HSBC 2006 Annual Report Download - page 56
Download and view the complete annual report
Please find page 56 of the 2006 HSBC annual report below. You can navigate through the pages in the report by either clicking on the pages listed below, or by using the keyword search tool below to find specific information within the annual report.-
 1
1 -
 2
2 -
 3
3 -
 4
4 -
 5
5 -
 6
6 -
 7
7 -
 8
8 -
 9
9 -
 10
10 -
 11
11 -
 12
12 -
 13
13 -
 14
14 -
 15
15 -
 16
16 -
 17
17 -
 18
18 -
 19
19 -
 20
20 -
 21
21 -
 22
22 -
 23
23 -
 24
24 -
 25
25 -
 26
26 -
 27
27 -
 28
28 -
 29
29 -
 30
30 -
 31
31 -
 32
32 -
 33
33 -
 34
34 -
 35
35 -
 36
36 -
 37
37 -
 38
38 -
 39
39 -
 40
40 -
 41
41 -
 42
42 -
 43
43 -
 44
44 -
 45
45 -
 46
46 -
 47
47 -
 48
48 -
 49
49 -
 50
50 -
 51
51 -
 52
52 -
 53
53 -
 54
54 -
 55
55 -
 56
56 -
 57
57 -
 58
58 -
 59
59 -
 60
60 -
 61
61 -
 62
62 -
 63
63 -
 64
64 -
 65
65 -
 66
66 -
 67
67 -
 68
68 -
 69
69 -
 70
70 -
 71
71 -
 72
72 -
 73
73 -
 74
74 -
 75
75 -
 76
76 -
 77
77 -
 78
78 -
 79
79 -
 80
80 -
 81
81 -
 82
82 -
 83
83 -
 84
84 -
 85
85 -
 86
86 -
 87
87 -
 88
88 -
 89
89 -
 90
90 -
 91
91 -
 92
92 -
 93
93 -
 94
94 -
 95
95 -
 96
96 -
 97
97 -
 98
98 -
 99
99 -
 100
100 -
 101
101 -
 102
102 -
 103
103 -
 104
104 -
 105
105 -
 106
106 -
 107
107 -
 108
108 -
 109
109 -
 110
110 -
 111
111 -
 112
112 -
 113
113 -
 114
114 -
 115
115 -
 116
116 -
 117
117 -
 118
118 -
 119
119 -
 120
120 -
 121
121 -
 122
122 -
 123
123 -
 124
124 -
 125
125 -
 126
126 -
 127
127 -
 128
128 -
 129
129 -
 130
130 -
 131
131 -
 132
132 -
 133
133 -
 134
134 -
 135
135 -
 136
136 -
 137
137 -
 138
138 -
 139
139 -
 140
140 -
 141
141 -
 142
142 -
 143
143 -
 144
144 -
 145
145 -
 146
146 -
 147
147 -
 148
148 -
 149
149 -
 150
150 -
 151
151 -
 152
152 -
 153
153 -
 154
154 -
 155
155 -
 156
156 -
 157
157 -
 158
158 -
 159
159 -
 160
160 -
 161
161 -
 162
162 -
 163
163 -
 164
164 -
 165
165 -
 166
166 -
 167
167 -
 168
168 -
 169
169 -
 170
170 -
 171
171 -
 172
172 -
 173
173 -
 174
174 -
 175
175 -
 176
176 -
 177
177 -
 178
178 -
 179
179 -
 180
180 -
 181
181 -
 182
182 -
 183
183 -
 184
184 -
 185
185 -
 186
186 -
 187
187 -
 188
188 -
 189
189 -
 190
190 -
 191
191 -
 192
192 -
 193
193 -
 194
194 -
 195
195 -
 196
196 -
 197
197 -
 198
198 -
 199
199 -
 200
200 -
 201
201 -
 202
202 -
 203
203 -
 204
204 -
 205
205 -
 206
206 -
 207
207 -
 208
208 -
 209
209 -
 210
210 -
 211
211 -
 212
212 -
 213
213 -
 214
214 -
 215
215 -
 216
216 -
 217
217 -
 218
218 -
 219
219 -
 220
220 -
 221
221 -
 222
222 -
 223
223 -
 224
224 -
 225
225 -
 226
226 -
 227
227 -
 228
228 -
 229
229 -
 230
230 -
 231
231 -
 232
232 -
 233
233 -
 234
234 -
 235
235 -
 236
236 -
 237
237 -
 238
238 -
 239
239 -
 240
240 -
 241
241 -
 242
242 -
 243
243 -
 244
244 -
 245
245 -
 246
246 -
 247
247 -
 248
248 -
 249
249 -
 250
250 -
 251
251 -
 252
252 -
 253
253 -
 254
254 -
 255
255 -
 256
256 -
 257
257 -
 258
258 -
 259
259 -
 260
260 -
 261
261 -
 262
262 -
 263
263 -
 264
264 -
 265
265 -
 266
266 -
 267
267 -
 268
268 -
 269
269 -
 270
270 -
 271
271 -
 272
272 -
 273
273 -
 274
274 -
 275
275 -
 276
276 -
 277
277 -
 278
278 -
 279
279 -
 280
280 -
 281
281 -
 282
282 -
 283
283 -
 284
284 -
 285
285 -
 286
286 -
 287
287 -
 288
288 -
 289
289 -
 290
290 -
 291
291 -
 292
292 -
 293
293 -
 294
294 -
 295
295 -
 296
296 -
 297
297 -
 298
298 -
 299
299 -
 300
300 -
 301
301 -
 302
302 -
 303
303 -
 304
304 -
 305
305 -
 306
306 -
 307
307 -
 308
308 -
 309
309 -
 310
310 -
 311
311 -
 312
312 -
 313
313 -
 314
314 -
 315
315 -
 316
316 -
 317
317 -
 318
318 -
 319
319 -
 320
320 -
 321
321 -
 322
322 -
 323
323 -
 324
324 -
 325
325 -
 326
326 -
 327
327 -
 328
328 -
 329
329 -
 330
330 -
 331
331 -
 332
332 -
 333
333 -
 334
334 -
 335
335 -
 336
336 -
 337
337 -
 338
338 -
 339
339 -
 340
340 -
 341
341 -
 342
342 -
 343
343 -
 344
344 -
 345
345 -
 346
346 -
 347
347 -
 348
348 -
 349
349 -
 350
350 -
 351
351 -
 352
352 -
 353
353 -
 354
354 -
 355
355 -
 356
356 -
 357
357 -
 358
358 -
 359
359 -
 360
360 -
 361
361 -
 362
362 -
 363
363 -
 364
364 -
 365
365 -
 366
366 -
 367
367 -
 368
368 -
 369
369 -
 370
370 -
 371
371 -
 372
372 -
 373
373 -
 374
374 -
 375
375 -
 376
376 -
 377
377 -
 378
378 -
 379
379 -
 380
380 -
 381
381 -
 382
382 -
 383
383 -
 384
384 -
 385
385 -
 386
386 -
 387
387 -
 388
388 -
 389
389 -
 390
390 -
 391
391 -
 392
392 -
 393
393 -
 394
394 -
 395
395 -
 396
396 -
 397
397 -
 398
398 -
 399
399 -
 400
400 -
 401
401 -
 402
402 -
 403
403 -
 404
404 -
 405
405 -
 406
406 -
 407
407 -
 408
408 -
 409
409 -
 410
410 -
 411
411 -
 412
412 -
 413
413 -
 414
414 -
 415
415 -
 416
416 -
 417
417 -
 418
418 -
 419
419 -
 420
420 -
 421
421 -
 422
422 -
 423
423 -
 424
424 -
 425
425 -
 426
426 -
 427
427 -
 428
428 -
 429
429 -
 430
430 -
 431
431 -
 432
432 -
 433
433 -
 434
434 -
 435
435 -
 436
436 -
 437
437 -
 438
438 -
 439
439 -
 440
440 -
 441
441 -
 442
442 -
 443
443 -
 444
444 -
 445
445 -
 446
446 -
 447
447 -
 448
448 -
 449
449 -
 450
450 -
 451
451 -
 452
452 -
 453
453 -
 454
454 -
 455
455 -
 456
456 -
 457
457 -
 458
458
 |
 |

HSBC HOLDINGS PLC
Report of the Directors: Business Review (continued)
Hong Kong > 2005
54
Net fees fell by 6 per cent to US$740 million,
driven mainly by lower sales of unit trusts and
capital guaranteed funds, partly offset by higher
sales of structured deposit products and open-ended
funds. A 34 per cent fall in unit trust fee income was
driven by a change in market sentiment during 2005.
The combined effect of higher interest rates and a
flattening yield curve reduced customer demand for
capital guaranteed funds and longer-term equity-
related investment products. Investors preferred
shorter-term investment products which in turn
generated lower fees. Revenues from open-ended
fund sales reflected this, increasing by 32 per cent to
US$95 million with the introduction of 173 new
funds increasing the choice available to investors.
This was an important strategic initiative to position
HSBC as the leading investment service provider in
Hong Kong, where customers can now choose from
over 300 funds.
Revenues from structured deposit products
grew, with strong sales volumes aided by new
products launched. The success of the Exclusive
Placement Service, launched in 2004 for HSBC
Premier customers, continued with year-on-year
revenue growth of 178 per cent. The service offers
an extensive product range of yield enhancement
options, re-priced daily and linked to foreign
exchange or interest rates. IPO certificate of deposit
offerings doubled. These were partly offset by lower
revenues from ‘Deposit plus’ and ‘Equity linked
note’ products.
Fee income from credit cards grew by 9 per
cent, reflecting a 21 per cent increase in spending
along with a 15 per cent rise in the number of cards
in circulation to four million. In stockbroking and
custody services, new services were launched aimed
at facilitating securities management by customers.
Competitive pricing and a high quality of service on
the internet led to a 15 per cent growth in customers
holding securities with HSBC.
HSBC continued to place significant emphasis
on the growth and development of its insurance
business, and increased the range of products
offered. Insurance revenues grew by 20 per cent,
aided by new products launched which included the
‘Five year excel’ and the ‘Three year express wealth’
joint life insurance and wealth products. HSBC was
Hong Kong’s leading online insurance provider,
offering 12 insurance products. This, coupled with
competitive pricing, led to a 91 per cent growth in
online insurance revenues. Medical insurance
products were enhanced and heavily marketed in
response to the growing public demand for private
medical protection to complement new medical
reforms being introduced.
Improvements in credit conditions, which
benefited from economic growth, higher property
prices and lower bankruptcies, underpinned a net
release of loan impairment charges and other credit
risk provisions of US$11 million in 2005, compared
with a net charge of US$56 million in 2004. This
was mainly driven by continued improvement in
credit quality within the credit card portfolio, and a
collective provision release of US$23 million in
respect of prior year impairment allowances on the
restructured lending portfolio. The strong housing
market enabled individually assessed allowance
releases of US$24 million in the mortgage portfolio.
There was also a release of US$11 million in respect
of collective loan impairment allowances, benefiting
from the improved economic conditions highlighted
above.
Operating expenses fell by 4 per cent to
US$1,305 million. This was largely due to a change
in the method by which centrally incurred costs are
allocated to the customer groups. IT development
costs rose in support of future growth initiatives, and
higher marketing and advertising expenditure was
incurred to underpin organic growth. Staff costs
were marginally lower in 2005. Branch teams were
restructured to dedicate more staff to sales and
customer service, and significant improvements were
made to the reward structure to ensure retention of
high calibre individuals. Overall, headcount in the
branch network fell by 4 per cent, reflecting
operating efficiency improvements and higher
utilisation of the Group Service Centres.
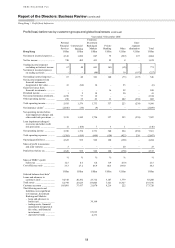
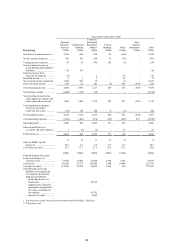
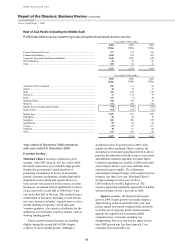
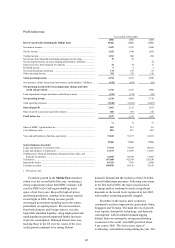
Pre-tax profits in Commercial Banking
increased by 6 per cent to US$955 million. Increased
deposit spreads and a rise in lending and deposit
balances led to higher net interest income, though
this was partly offset by larger loan impairment
charges and the non-recurrence of loan allowance
releases.
Net interest income increased by 60 per cent as
a result of increased deposit spreads and asset and
liability growth. The appointment of a number of
experienced relationship managers to service key
accounts, together with the establishment of core
business banking centres, contributed to growth in
deposits and lending. Interest rate rises led to a
67 basis point increase in deposit spreads and,
together with active management of the deposit base,
contributed to increased customer demand for
savings products which resulted in a 6 per cent
increase in deposit balances to US$28.7 billion. The
introduction of a pre-approved lending programme
for SMEs, together with strong demand for credit in
the property, manufacturing, trading and retail
sectors, contributed to a 29 per cent increase in
