HSBC 2006 Annual Report Download - page 366
Download and view the complete annual report
Please find page 366 of the 2006 HSBC annual report below. You can navigate through the pages in the report by either clicking on the pages listed below, or by using the keyword search tool below to find specific information within the annual report.-
 1
1 -
2
-
3
-
4
-
5
-
6
-
7
-
8
-
9
-
10
-
11
-
12
-
13
-
14
-
15
-
16
-
17
-
18
-
19
-
20
-
21
-
22
-
23
-
24
-
25
-
26
-
27
-
28
-
29
-
30
-
31
-
32
-
33
-
34
-
35
-
36
-
37
-
38
-
39
-
40
-
41
-
42
-
43
-
44
-
45
-
46
-
47
-
48
-
49
-
50
-
51
-
52
-
53
-
54
-
55
-
56
-
57
-
58
-
59
-
60
-
61
-
62
-
63
-
64
-
65
-
66
-
67
-
68
-
69
-
70
-
71
-
72
-
73
-
74
-
75
-
76
-
77
-
78
-
79
-
80
-
81
-
82
-
83
-
84
-
85
-
86
-
87
-
88
-
89
-
90
-
91
-
92
-
93
-
94
-
95
-
96
-
97
-
98
-
99
-
100
-
101
-
102
-
103
-
104
-
105
-
106
-
107
-
108
-
109
-
110
-
111
-
112
-
113
-
114
-
115
-
116
-
117
-
118
-
119
-
120
-
121
-
122
-
123
-
124
-
125
-
126
-
127
-
128
-
129
-
130
-
131
-
132
-
133
-
134
-
135
-
136
-
137
-
138
-
139
-
140
-
141
-
142
-
143
-
144
-
145
-
146
-
147
-
148
-
149
-
150
-
151
-
152
-
153
-
154
-
155
-
156
-
157
-
158
-
159
-
160
-
161
-
162
-
163
-
164
-
165
-
166
-
167
-
168
-
169
-
170
-
171
-
172
-
173
-
174
-
175
-
176
-
177
-
178
-
179
-
180
-
181
-
182
-
183
-
184
-
185
-
186
-
187
-
188
-
189
-
190
-
191
-
192
-
193
-
194
-
195
-
196
-
197
-
198
-
199
-
200
-
201
-
202
-
203
-
204
-
205
-
206
-
207
-
208
-
209
-
210
-
211
-
212
-
213
-
214
-
215
-
216
-
217
-
218
-
219
-
220
-
221
-
222
-
223
-
224
-
225
-
226
-
227
-
228
-
229
-
230
-
231
-
232
-
233
-
234
-
235
-
236
-
237
-
238
-
239
-
240
-
241
-
242
-
243
-
244
-
245
-
246
-
247
-
248
-
249
-
250
-
251
-
252
-
253
-
254
-
255
-
256
-
257
-
258
-
259
-
260
-
261
-
262
-
263
-
264
-
265
-
266
-
267
-
268
-
269
-
270
-
271
-
272
-
273
-
274
-
275
-
276
-
277
-
278
-
279
-
280
-
281
-
282
-
283
-
284
-
285
-
286
-
287
-
288
-
289
-
290
-
291
-
292
-
293
-
294
-
295
-
296
-
297
-
298
-
299
-
300
-
301
-
302
-
303
-
304
-
305
-
306
-
307
-
308
-
309
-
310
-
311
-
312
-
313
-
314
-
315
-
316
-
317
-
318
-
319
-
320
-
321
-
322
-
323
-
324
-
325
-
326
-
327
-
328
-
329
-
330
-
331
-
332
-
333
-
334
-
335
-
336
-
337
-
338
-
339
-
340
-
341
-
342
-
343
-
344
-
345
-
346
-
347
-
348
-
349
-
350
-
351
-
352
-
353
-
354
-
355
-
 356
356 -
 357
357 -
 358
358 -
 359
359 -
 360
360 -
 361
361 -
 362
362 -
 363
363 -
 364
364 -
 365
365 -
 366
366 -
 367
367 -
 368
368 -
 369
369 -
 370
370 -
 371
371 -
 372
372 -
 373
373 -
 374
374 -
 375
375 -
 376
376 -
377
-
378
-
379
-
380
-
381
-
382
-
383
-
384
-
385
-
386
-
387
-
388
-
389
-
390
-
391
-
392
-
393
-
394
-
395
-
396
-
397
-
398
-
399
-
400
-
401
-
402
-
403
-
404
-
405
-
406
-
407
-
408
-
409
-
410
-
411
-
412
-
413
-
414
-
415
-
416
-
417
-
418
-
419
-
420
-
421
-
422
-
423
-
424
-
425
-
426
-
427
-
428
-
429
-
430
-
431
-
432
-
433
-
434
-
435
-
436
-
437
-
438
-
439
-
440
-
441
-
442
-
443
-
444
-
445
-
446
-
447
-
448
-
449
-
450
-
451
-
452
-
453
-
454
-
455
-
456
-
457
-
458
 |
 |

HSBC HOLDINGS PLC
Notes on the Financial Statements (continued)
Notes 21 and 22
364
Trade
names
Mortgage
servicing
rights
Internally
generated
software
Purchased
software
Customer/
merchant
relation-
ships Other Total
US$m US$m US$m US$m US$m US$m US$m
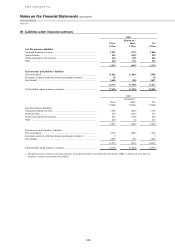
Cost
At 1 January 2005 ....................... 41 791 1,823 210 764 393 4,022
Additions1 ................................... – 136 420 49 13 8 626
Acquisition of subsidiaries ......... – – – – 271 – 271
Disposals ..................................... – – – (63) (15) (1) (79)
Exchange differences .................. 2 2 (104) (19) (72) (44) (235)
Other changes ............................. – 50 (45) 118 73 17 213
At 31 December 2005 ................. 43 979 2,094 295 1,034 373 4,818
Accumulated amortisation
At 1 January 2005 ....................... (8) (474) (1,064) (115) (95) (7) (1,763)
Charge for the year2 .................... (6) (27) (354) (76) (99) (19) (581)
Disposals ..................................... – – – 29 – – 29
Exchange differences .................. (1) 1 123 (37) 5 2 93
Other changes ............................. – (60) (6) 29 16 – (21)
At 31 December 2005 ................. (15) (560) (1,301) (170) (173) (24) (2,243)
Net carrying amount at
31 December 2005 ................. 28 419 793 125 861 349 2,575
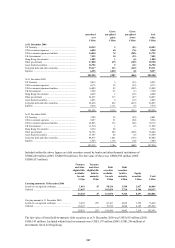
1 At 31 December 2006, HSBC had US$23 million (2005: US$56 million) of contractual commitments to acquire intangible assets.
2 The amortisation charge for the year is recognised within the income statement under ‘Amortisation and impairment of intangible
assets’, with the exception of the amortisation of mortgage servicing rights that is charged to net fee income.
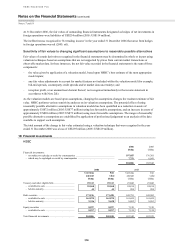
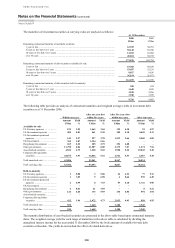
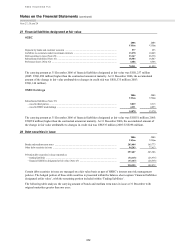
22 Impairment of assets other than financial instruments
During 2006 there was no impairment of goodwill (2005: nil; 2004: nil). Impairment testing in respect of goodwill is
performed annually by comparing the recoverable amount of cash generating units (‘CGUs’) determined at 1 July
2006 based on a value in use calculation. That calculation uses cash flow estimates based on management’s cash flow
projections, extrapolated in perpetuity using a nominal long-term growth rate based on current GDP and inflation for
the countries within which the CGU operates. Cash flows are extrapolated in perpetuity due to the long-term
perspective within the Group of the business units making up the CGUs. The discount rate used is based on the cost
of capital HSBC allocates to investments in the countries within which the CGU operates.
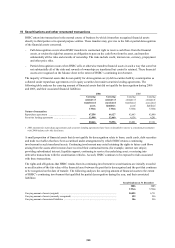
The cost of capital assigned to an individual CGU and used to discount its future cash flows can have a significant
effect on its valuation. The cost of capital percentage is generally derived from an appropriate capital asset pricing
model, which itself depends on inputs reflecting a number of financial and economic variables including the risk-free
rate in the country concerned and a premium to reflect the inherent risk of the business being evaluated. These
variables are established on the basis of management judgement.
Management judgement is required in estimating the future cash flows of the CGUs. These values are sensitive to the
cash flows projected for the periods for which detailed forecasts are available, and to assumptions regarding the long-
term sustainable pattern of cash flows thereafter. While the acceptable range within which underlying assumptions
can be applied is governed by the requirement for resulting forecasts to be compared with actual performance and
verifiable economic data in future years, the cash flow forecasts necessarily and appropriately reflect management’s
view of future business prospects.
The following CGUs include in their carrying value goodwill that is a significant proportion of total goodwill
reported by HSBC. These CGUs do not carry on their balance sheets any intangible assets with indefinite useful
lives, other than goodwill.