HSBC 2006 Annual Report Download - page 81
Download and view the complete annual report
Please find page 81 of the 2006 HSBC annual report below. You can navigate through the pages in the report by either clicking on the pages listed below, or by using the keyword search tool below to find specific information within the annual report.-
 1
1 -
2
-
3
-
4
-
5
-
6
-
7
-
8
-
9
-
10
-
11
-
12
-
13
-
14
-
15
-
16
-
17
-
18
-
19
-
20
-
21
-
22
-
23
-
24
-
25
-
26
-
27
-
28
-
29
-
30
-
31
-
32
-
33
-
34
-
35
-
36
-
37
-
38
-
39
-
40
-
41
-
42
-
43
-
44
-
45
-
46
-
47
-
48
-
49
-
50
-
51
-
52
-
53
-
54
-
55
-
56
-
57
-
58
-
59
-
60
-
61
-
62
-
63
-
64
-
65
-
66
-
67
-
68
-
69
-
70
-
 71
71 -
 72
72 -
 73
73 -
 74
74 -
 75
75 -
 76
76 -
 77
77 -
 78
78 -
 79
79 -
 80
80 -
 81
81 -
 82
82 -
 83
83 -
 84
84 -
 85
85 -
 86
86 -
 87
87 -
 88
88 -
 89
89 -
 90
90 -
 91
91 -
92
-
93
-
94
-
95
-
96
-
97
-
98
-
99
-
100
-
101
-
102
-
103
-
104
-
105
-
106
-
107
-
108
-
109
-
110
-
111
-
112
-
113
-
114
-
115
-
116
-
117
-
118
-
119
-
120
-
121
-
122
-
123
-
124
-
125
-
126
-
127
-
128
-
129
-
130
-
131
-
132
-
133
-
134
-
135
-
136
-
137
-
138
-
139
-
140
-
141
-
142
-
143
-
144
-
145
-
146
-
147
-
148
-
149
-
150
-
151
-
152
-
153
-
154
-
155
-
156
-
157
-
158
-
159
-
160
-
161
-
162
-
163
-
164
-
165
-
166
-
167
-
168
-
169
-
170
-
171
-
172
-
173
-
174
-
175
-
176
-
177
-
178
-
179
-
180
-
181
-
182
-
183
-
184
-
185
-
186
-
187
-
188
-
189
-
190
-
191
-
192
-
193
-
194
-
195
-
196
-
197
-
198
-
199
-
200
-
201
-
202
-
203
-
204
-
205
-
206
-
207
-
208
-
209
-
210
-
211
-
212
-
213
-
214
-
215
-
216
-
217
-
218
-
219
-
220
-
221
-
222
-
223
-
224
-
225
-
226
-
227
-
228
-
229
-
230
-
231
-
232
-
233
-
234
-
235
-
236
-
237
-
238
-
239
-
240
-
241
-
242
-
243
-
244
-
245
-
246
-
247
-
248
-
249
-
250
-
251
-
252
-
253
-
254
-
255
-
256
-
257
-
258
-
259
-
260
-
261
-
262
-
263
-
264
-
265
-
266
-
267
-
268
-
269
-
270
-
271
-
272
-
273
-
274
-
275
-
276
-
277
-
278
-
279
-
280
-
281
-
282
-
283
-
284
-
285
-
286
-
287
-
288
-
289
-
290
-
291
-
292
-
293
-
294
-
295
-
296
-
297
-
298
-
299
-
300
-
301
-
302
-
303
-
304
-
305
-
306
-
307
-
308
-
309
-
310
-
311
-
312
-
313
-
314
-
315
-
316
-
317
-
318
-
319
-
320
-
321
-
322
-
323
-
324
-
325
-
326
-
327
-
328
-
329
-
330
-
331
-
332
-
333
-
334
-
335
-
336
-
337
-
338
-
339
-
340
-
341
-
342
-
343
-
344
-
345
-
346
-
347
-
348
-
349
-
350
-
351
-
352
-
353
-
354
-
355
-
356
-
357
-
358
-
359
-
360
-
361
-
362
-
363
-
364
-
365
-
366
-
367
-
368
-
369
-
370
-
371
-
372
-
373
-
374
-
375
-
376
-
377
-
378
-
379
-
380
-
381
-
382
-
383
-
384
-
385
-
386
-
387
-
388
-
389
-
390
-
391
-
392
-
393
-
394
-
395
-
396
-
397
-
398
-
399
-
400
-
401
-
402
-
403
-
404
-
405
-
406
-
407
-
408
-
409
-
410
-
411
-
412
-
413
-
414
-
415
-
416
-
417
-
418
-
419
-
420
-
421
-
422
-
423
-
424
-
425
-
426
-
427
-
428
-
429
-
430
-
431
-
432
-
433
-
434
-
435
-
436
-
437
-
438
-
439
-
440
-
441
-
442
-
443
-
444
-
445
-
446
-
447
-
448
-
449
-
450
-
451
-
452
-
453
-
454
-
455
-
456
-
457
-
458
 |
 |
79
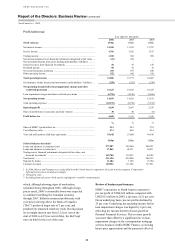
portfolio, improved interchange rates and lower fee
charge-offs. Revenues from credit card partnership
enhancement services rose due to greater sales
volumes, expansion into new customer segments and
balance growth.
Within the US retail services business, net fee
income rose, reflecting lower merchant payments, in
part due to changes in contract obligations with
certain merchants. A rise in late fees from growth in
customer account balances and higher fees on
overdue payments contributed further to the
increase.
In the US mortgage-banking business, net fee
income declined. Although mortgage loan service
volumes grew in 2006, contributing additional fee
income from the greater proportion of mortgages
originated and then sold with mortgage servicing
rights retained, these benefits were more than offset
by higher amortisation charges and lower releases of
temporary impairment provisions on mortgage
servicing rights. The taxpayer financial services
business generated higher fee income from increased
loan volumes during the 2006 tax season.
In Canada, net fee income rose by 5 per cent to
US$217 million. Continued growth in the wealth
management business resulted in higher investment
administration fees, and credit card fee income rose,
driven by increased lending.
Trading income fell by 17 per cent, due to lower
income on HSBC Finance’s Decision One mortgage
balances held for resale to secondary market
purchasers. This primarily reflected additional losses
incurred following the repurchase of certain
mortgages previously sold to external third parties
which had subsequently gone into default. Higher
losses on derivatives that did not meet the criteria for
hedge accounting contributed further to the decrease.
A US$20 million gain from the MasterCard
Incorporated IPO was the key reason for the increase
in gains from financial instruments.
Other operating income also rose, primarily
driven by gains on various asset disposals. Most
notably, a US$123 million profit was achieved on
disposal of HSBC’s investment in Kanbay
International Inc, a worldwide information
technology services firm. Income from overnight
and short-term money market investments also rose.
These benefits were partly offset by greater losses
incurred on sales of repossessed properties,
following a 42 per cent rise in such properties as
customers defaulted on their mortgage payments.
Loan impairment charges and other credit risk
provisions of US$6,683 million were 28 per cent
higher than in 2005. In the US, loan impairment
charges rose by 28 per cent despite the non-
recurrence of significant charges which arose in
2005 following hurricane Katrina and increased
levels of bankruptcy filings in the final quarter of the
year. Loan impairment charges were also higher in
the second half of 2006 compared with both the
preceding half and the second half of 2005. The
increase was primarily driven by significantly higher
delinquencies and losses in the mortgage services
correspondent business, concentrated in second lien
and portions of first lien mortgages originated and
purchased in 2005 and 2006. As noted previously,
HSBC witnessed a deterioration in the performance
of these 2005 originations during the first half of
2006. This deterioration continued into the third
quarter and started to affect equivalent loans
originated in 2006. In the final quarter of 2006,
deterioration of these loans, largely the first lien
adjustable rate and second lien loans, worsened
considerably. The heightened risk of loss was
attributable to lower equity in homes as price growth
moderated or reversed, together with a higher
prospective interest burden from ARM resets. As
many of these mortgages were being re-priced in an
environment of higher interest rates, slower asset
price appreciation and tightening credit, HSBC
considers it highly likely that these factors will lead
to increased instances of default in the future on both
first and any associated second lien loans.
Accordingly, a significant increase in loan
impairment charges was recorded in the final
quarter of the year.
Higher lending, the seasoning1 of the loan
portfolio, and a return to more normal historical
levels of delinquency from the exceptionally
favourable credit conditions experienced in recent
periods, all contributed to the overall increase in
impairment charges in the US. This was partly offset
by lower numbers and levels of bankruptcy filings
and the positive effect of low unemployment. The
credit card business, in addition, benefited from
improved recovery rates from loans previously
written off. Notwithstanding the accelerated credit
weakness witnessed in the mortgage services
correspondent business, credit performance as
measured by delinquency and loss in the majority of
the other lending portfolios, including mortgage
balances originated through the branch-based
consumer lending business gradually deteriorated
from the seasoning of a growing portfolio and the
rising proportion of credit card balances. Loan
impairment charges in these portfolios were
1 ‘Seasoning’ describes the emergence of credit
loss
p
atterns in
p
ort
f
olios over time.