HSBC 2006 Annual Report Download - page 124
Download and view the complete annual report
Please find page 124 of the 2006 HSBC annual report below. You can navigate through the pages in the report by either clicking on the pages listed below, or by using the keyword search tool below to find specific information within the annual report.-
 1
1 -
2
-
3
-
4
-
5
-
6
-
7
-
8
-
9
-
10
-
11
-
12
-
13
-
14
-
15
-
16
-
17
-
18
-
19
-
20
-
21
-
22
-
23
-
24
-
25
-
26
-
27
-
28
-
29
-
30
-
31
-
32
-
33
-
34
-
35
-
36
-
37
-
38
-
39
-
40
-
41
-
42
-
43
-
44
-
45
-
46
-
47
-
48
-
49
-
50
-
51
-
52
-
53
-
54
-
55
-
56
-
57
-
58
-
59
-
60
-
61
-
62
-
63
-
64
-
65
-
66
-
67
-
68
-
69
-
70
-
71
-
72
-
73
-
74
-
75
-
76
-
77
-
78
-
79
-
80
-
81
-
82
-
83
-
84
-
85
-
86
-
87
-
88
-
89
-
90
-
91
-
92
-
93
-
94
-
95
-
96
-
97
-
98
-
99
-
100
-
101
-
102
-
103
-
104
-
105
-
106
-
107
-
108
-
109
-
110
-
111
-
112
-
113
-
 114
114 -
 115
115 -
 116
116 -
 117
117 -
 118
118 -
 119
119 -
 120
120 -
 121
121 -
 122
122 -
 123
123 -
 124
124 -
 125
125 -
 126
126 -
 127
127 -
 128
128 -
 129
129 -
 130
130 -
 131
131 -
 132
132 -
 133
133 -
 134
134 -
135
-
136
-
137
-
138
-
139
-
140
-
141
-
142
-
143
-
144
-
145
-
146
-
147
-
148
-
149
-
150
-
151
-
152
-
153
-
154
-
155
-
156
-
157
-
158
-
159
-
160
-
161
-
162
-
163
-
164
-
165
-
166
-
167
-
168
-
169
-
170
-
171
-
172
-
173
-
174
-
175
-
176
-
177
-
178
-
179
-
180
-
181
-
182
-
183
-
184
-
185
-
186
-
187
-
188
-
189
-
190
-
191
-
192
-
193
-
194
-
195
-
196
-
197
-
198
-
199
-
200
-
201
-
202
-
203
-
204
-
205
-
206
-
207
-
208
-
209
-
210
-
211
-
212
-
213
-
214
-
215
-
216
-
217
-
218
-
219
-
220
-
221
-
222
-
223
-
224
-
225
-
226
-
227
-
228
-
229
-
230
-
231
-
232
-
233
-
234
-
235
-
236
-
237
-
238
-
239
-
240
-
241
-
242
-
243
-
244
-
245
-
246
-
247
-
248
-
249
-
250
-
251
-
252
-
253
-
254
-
255
-
256
-
257
-
258
-
259
-
260
-
261
-
262
-
263
-
264
-
265
-
266
-
267
-
268
-
269
-
270
-
271
-
272
-
273
-
274
-
275
-
276
-
277
-
278
-
279
-
280
-
281
-
282
-
283
-
284
-
285
-
286
-
287
-
288
-
289
-
290
-
291
-
292
-
293
-
294
-
295
-
296
-
297
-
298
-
299
-
300
-
301
-
302
-
303
-
304
-
305
-
306
-
307
-
308
-
309
-
310
-
311
-
312
-
313
-
314
-
315
-
316
-
317
-
318
-
319
-
320
-
321
-
322
-
323
-
324
-
325
-
326
-
327
-
328
-
329
-
330
-
331
-
332
-
333
-
334
-
335
-
336
-
337
-
338
-
339
-
340
-
341
-
342
-
343
-
344
-
345
-
346
-
347
-
348
-
349
-
350
-
351
-
352
-
353
-
354
-
355
-
356
-
357
-
358
-
359
-
360
-
361
-
362
-
363
-
364
-
365
-
366
-
367
-
368
-
369
-
370
-
371
-
372
-
373
-
374
-
375
-
376
-
377
-
378
-
379
-
380
-
381
-
382
-
383
-
384
-
385
-
386
-
387
-
388
-
389
-
390
-
391
-
392
-
393
-
394
-
395
-
396
-
397
-
398
-
399
-
400
-
401
-
402
-
403
-
404
-
405
-
406
-
407
-
408
-
409
-
410
-
411
-
412
-
413
-
414
-
415
-
416
-
417
-
418
-
419
-
420
-
421
-
422
-
423
-
424
-
425
-
426
-
427
-
428
-
429
-
430
-
431
-
432
-
433
-
434
-
435
-
436
-
437
-
438
-
439
-
440
-
441
-
442
-
443
-
444
-
445
-
446
-
447
-
448
-
449
-
450
-
451
-
452
-
453
-
454
-
455
-
456
-
457
-
458
 |
 |

HSBC HOLDINGS PLC
Report of the Directors: Financial Review (continued)
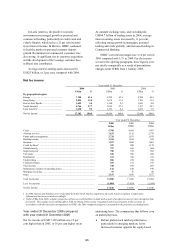
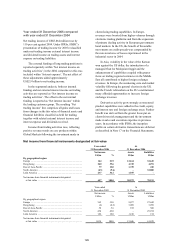
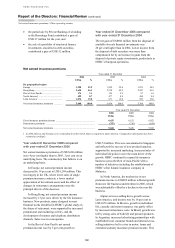
Net interest income
122
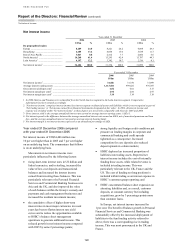
Net interest income
Year ended 31 December
2006 2005 2004
US$m % US$m % US$m %
By geographical region
Europe ...................................................... 8,289 24.0 8,221 26.2 9,098 29.3
Hong Kong .............................................. 4,685 13.6 4,064 13.0 3,638 11.7
Rest of Asia-Pacific ................................. 3,047 8.8 2,412 7.7 2,060 6.6
North America1 ........................................ 14,268 41.4 13,295 42.4 13,787 44.3
Latin America1 ......................................... 4,197 12.2 3,342 10.7 2,516 8.1
Net interest income2 ................................. 34,486 100.0 31,334 100.0 31,099 100.0
Year ended 31 December
2006
US$m
2005
US$m
2004
US$m
Net interest income2.......................................................................................... 34,486 31,334 31,099
Average interest-earning assets ....................................................................... 1,113,404 999,421 976,387
Gross interest yield (per cent)3 ........................................................................ 6.82 6.01 5.17
Net interest spread (per cent)4 ......................................................................... 2.94 2.84 2.97
Net interest margin (per cent)5 ........................................................................ 3.10 3.14 3.19
1 In 2006, Mexico and Panama were reclassified from the North America segment to the Latin America segment. Comparative
information has been restated accordingly.
2 ‘Net interest income’ comprises interest income less interest expense on financial assets and liabilities which is not recognised as part of
‘Net trading income’ or ‘Net income earned from financial instruments designated at fair value’. In 2004, all interest income and
expense was included within ‘Net interest income’ so these figures are not strictly comparable with those for 2005 and 2006.
3 Gross interest yield is the average annualised interest rate earned on average interest-earning assets (‘AIEA’).
4 Net interest spread is the difference between the average annualised interest rate earned on AIEA, net of amortised premiums and loan
fees, and the average annualised interest rate paid on average interest-bearing funds.
5 Net interest margin is net interest income expressed as an annualised percentage of AIEA.
Year ended 31 December 2006 compared
with year ended 31 December 2005
Net interest income of US$34,486 million was
10 per cent higher than in 2005 and 7 per cent higher
on an underlying basis. The commentary that follows
is on an underlying basis.
Movements in net interest income were
particularly influenced by the following factors:
• rising short-term interest rates in US dollars and
linked currencies, and in sterling, increased the
value of low-cost deposits and transactional
balances and increased the interest income
earned from investing those balances. This was
particularly relevant to the Personal Financial
Services and Commercial Banking businesses in
Asia and the UK, and also improved the value
of cash balances within the Group’s custody and
payments and cash management businesses and
increased the resultant investment income;
• the cumulative effect of higher short-term
interest rates in most major currencies in recent
years has been to flatten interest rate yield
curves and to reduce the opportunities available
to HSBC’s balance sheet management
operations to generate additional income. This
reduced growth in net interest income compared
with 2005 by some 2 percentage points;
• strong liquidity and benign credit conditions put
pressure on lending margins in corporate and
commercial banking and credit spreads
tightened as a consequence. Increased
competition for core deposits also reduced
deposit spreads in certain markets;
• HSBC deployed an increased proportion of
liabilities into trading assets. Reported net
interest income includes the cost of internally
funding these assets, while related revenue is
included in trading income. This was
particularly relevant to the UK, France and the
US. The cost of funding net long positions is
included within trading as an interest expense in
HSBC’s customer group reporting; and
• HSBC concentrated balance sheet expansion on
attracting liabilities and, as a result, customer
deposits, at constant currency but including
acquisitions, grew by 3 percentage points more
than customer loans.
In Europe, net interest income increased by
1 per cent. The benefit of balance growth in Personal
Financial Services and Commercial Banking was
substantially offset by the increased deployment of
liabilities to the fund trading activity referred to
above; there was a corresponding rise in trading
income. This was most pronounced in the UK and
France.