HSBC 2006 Annual Report Download - page 388
Download and view the complete annual report
Please find page 388 of the 2006 HSBC annual report below. You can navigate through the pages in the report by either clicking on the pages listed below, or by using the keyword search tool below to find specific information within the annual report.-
 1
1 -
2
-
3
-
4
-
5
-
6
-
7
-
8
-
9
-
10
-
11
-
12
-
13
-
14
-
15
-
16
-
17
-
18
-
19
-
20
-
21
-
22
-
23
-
24
-
25
-
26
-
27
-
28
-
29
-
30
-
31
-
32
-
33
-
34
-
35
-
36
-
37
-
38
-
39
-
40
-
41
-
42
-
43
-
44
-
45
-
46
-
47
-
48
-
49
-
50
-
51
-
52
-
53
-
54
-
55
-
56
-
57
-
58
-
59
-
60
-
61
-
62
-
63
-
64
-
65
-
66
-
67
-
68
-
69
-
70
-
71
-
72
-
73
-
74
-
75
-
76
-
77
-
78
-
79
-
80
-
81
-
82
-
83
-
84
-
85
-
86
-
87
-
88
-
89
-
90
-
91
-
92
-
93
-
94
-
95
-
96
-
97
-
98
-
99
-
100
-
101
-
102
-
103
-
104
-
105
-
106
-
107
-
108
-
109
-
110
-
111
-
112
-
113
-
114
-
115
-
116
-
117
-
118
-
119
-
120
-
121
-
122
-
123
-
124
-
125
-
126
-
127
-
128
-
129
-
130
-
131
-
132
-
133
-
134
-
135
-
136
-
137
-
138
-
139
-
140
-
141
-
142
-
143
-
144
-
145
-
146
-
147
-
148
-
149
-
150
-
151
-
152
-
153
-
154
-
155
-
156
-
157
-
158
-
159
-
160
-
161
-
162
-
163
-
164
-
165
-
166
-
167
-
168
-
169
-
170
-
171
-
172
-
173
-
174
-
175
-
176
-
177
-
178
-
179
-
180
-
181
-
182
-
183
-
184
-
185
-
186
-
187
-
188
-
189
-
190
-
191
-
192
-
193
-
194
-
195
-
196
-
197
-
198
-
199
-
200
-
201
-
202
-
203
-
204
-
205
-
206
-
207
-
208
-
209
-
210
-
211
-
212
-
213
-
214
-
215
-
216
-
217
-
218
-
219
-
220
-
221
-
222
-
223
-
224
-
225
-
226
-
227
-
228
-
229
-
230
-
231
-
232
-
233
-
234
-
235
-
236
-
237
-
238
-
239
-
240
-
241
-
242
-
243
-
244
-
245
-
246
-
247
-
248
-
249
-
250
-
251
-
252
-
253
-
254
-
255
-
256
-
257
-
258
-
259
-
260
-
261
-
262
-
263
-
264
-
265
-
266
-
267
-
268
-
269
-
270
-
271
-
272
-
273
-
274
-
275
-
276
-
277
-
278
-
279
-
280
-
281
-
282
-
283
-
284
-
285
-
286
-
287
-
288
-
289
-
290
-
291
-
292
-
293
-
294
-
295
-
296
-
297
-
298
-
299
-
300
-
301
-
302
-
303
-
304
-
305
-
306
-
307
-
308
-
309
-
310
-
311
-
312
-
313
-
314
-
315
-
316
-
317
-
318
-
319
-
320
-
321
-
322
-
323
-
324
-
325
-
326
-
327
-
328
-
329
-
330
-
331
-
332
-
333
-
334
-
335
-
336
-
337
-
338
-
339
-
340
-
341
-
342
-
343
-
344
-
345
-
346
-
347
-
348
-
349
-
350
-
351
-
352
-
353
-
354
-
355
-
356
-
357
-
358
-
359
-
360
-
361
-
362
-
363
-
364
-
365
-
366
-
367
-
368
-
369
-
370
-
371
-
372
-
373
-
374
-
375
-
376
-
377
-
 378
378 -
 379
379 -
 380
380 -
 381
381 -
 382
382 -
 383
383 -
 384
384 -
 385
385 -
 386
386 -
 387
387 -
 388
388 -
 389
389 -
 390
390 -
 391
391 -
 392
392 -
 393
393 -
 394
394 -
 395
395 -
 396
396 -
 397
397 -
 398
398 -
399
-
400
-
401
-
402
-
403
-
404
-
405
-
406
-
407
-
408
-
409
-
410
-
411
-
412
-
413
-
414
-
415
-
416
-
417
-
418
-
419
-
420
-
421
-
422
-
423
-
424
-
425
-
426
-
427
-
428
-
429
-
430
-
431
-
432
-
433
-
434
-
435
-
436
-
437
-
438
-
439
-
440
-
441
-
442
-
443
-
444
-
445
-
446
-
447
-
448
-
449
-
450
-
451
-
452
-
453
-
454
-
455
-
456
-
457
-
458
 |
 |

HSBC HOLDINGS PLC
Notes on the Financial Statements (continued)
Notes 35, 36, 37 and 38
386
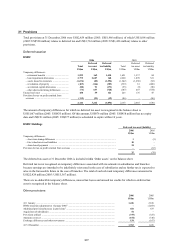
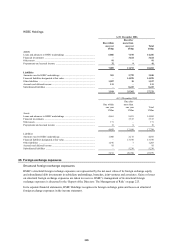
Net structural foreign exchange exposures
2006 2005
US$m US$m
Currency of structural exposure
Euros .................................................................................................................................................. 21,202 18,821
Sterling ............................................................................................................................................... 18,562 15,615
Chinese renminbi ............................................................................................................................... 5,678 5,135
Mexican pesos ................................................................................................................................... 4,536 3,777
Hong Kong dollars ............................................................................................................................. 4,461 2,945
Canadian dollars ................................................................................................................................ 3,284 2,926
Brazilian reais .................................................................................................................................... 2,684 2,174
Swiss francs ....................................................................................................................................... 2,495 1,957
UAE dirhams ..................................................................................................................................... 1,647 1,111
Indian rupees ...................................................................................................................................... 1,575 1,182
Turkish lira ......................................................................................................................................... 970 919
Malaysian ringgit ............................................................................................................................... 876 705
Korean won ........................................................................................................................................ 769 506
Australian dollars ............................................................................................................................... 692 609
Singapore dollars ............................................................................................................................... 411 334
Japanese yen ...................................................................................................................................... 338 252
Egyptian pounds ................................................................................................................................ 325 234
Thai baht ............................................................................................................................................ 305 234
Taiwanese dollars .............................................................................................................................. 299 298
Saudi riyals1 ....................................................................................................................................... 286 347
Maltese lira ........................................................................................................................................ 269 250
Philippine pesos ................................................................................................................................. 213 176
Argentine pesos2 ................................................................................................................................ 211 (85)
Chilean pesos ..................................................................................................................................... 189 187
Costa Rican colon .............................................................................................................................. 162 –
New Zealand dollars .......................................................................................................................... 158 141
Indonesia rupiah ................................................................................................................................. 155 188
Qatari rial ........................................................................................................................................... 150 98
Honduran lempira .............................................................................................................................. 148 –
Omani rial .......................................................................................................................................... 114 78
South African rand ............................................................................................................................. 106 106
Others, each less than US$100 million .............................................................................................. 839 611
Total ................................................................................................................................................... 74,109 61,831
1 After deducting sales of Saudi riyals amounting to US$750 million (2005: US$480 million) in order to manage the foreign exchange risk
of the investments.
2 The negative net investment in Argentine pesos in 2005 reflects the deficiency in domestic net assets following the pesification of certain
balances formerly denominated in US dollars.
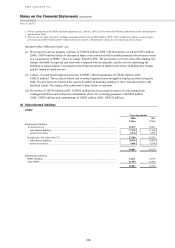
36 Assets charged as security for liabilities and collateral accepted as security for assets
Financial assets pledged to secure liabilities are as follows:
Assets pledged at
31 December
2006 2005
US$m US$m
Treasury bills and other eligible securities ........................................................................................ 6,480 7,607
Loans and advances to banks ............................................................................................................ 934 1,310
Loans and advances to customers ...................................................................................................... 63,956 36,590
Debt securities ................................................................................................................................... 106,652 89,973
Equity shares ...................................................................................................................................... 11,634 5,137
Other .................................................................................................................................................. 390 537
190,046 141,154
These transactions are conducted under terms that are usual and customary to standard lending, and stock borrowing
and lending activities.