HSBC 2006 Annual Report Download - page 204
Download and view the complete annual report
Please find page 204 of the 2006 HSBC annual report below. You can navigate through the pages in the report by either clicking on the pages listed below, or by using the keyword search tool below to find specific information within the annual report.-
 1
1 -
2
-
3
-
4
-
5
-
6
-
7
-
8
-
9
-
10
-
11
-
12
-
13
-
14
-
15
-
16
-
17
-
18
-
19
-
20
-
21
-
22
-
23
-
24
-
25
-
26
-
27
-
28
-
29
-
30
-
31
-
32
-
33
-
34
-
35
-
36
-
37
-
38
-
39
-
40
-
41
-
42
-
43
-
44
-
45
-
46
-
47
-
48
-
49
-
50
-
51
-
52
-
53
-
54
-
55
-
56
-
57
-
58
-
59
-
60
-
61
-
62
-
63
-
64
-
65
-
66
-
67
-
68
-
69
-
70
-
71
-
72
-
73
-
74
-
75
-
76
-
77
-
78
-
79
-
80
-
81
-
82
-
83
-
84
-
85
-
86
-
87
-
88
-
89
-
90
-
91
-
92
-
93
-
94
-
95
-
96
-
97
-
98
-
99
-
100
-
101
-
102
-
103
-
104
-
105
-
106
-
107
-
108
-
109
-
110
-
111
-
112
-
113
-
114
-
115
-
116
-
117
-
118
-
119
-
120
-
121
-
122
-
123
-
124
-
125
-
126
-
127
-
128
-
129
-
130
-
131
-
132
-
133
-
134
-
135
-
136
-
137
-
138
-
139
-
140
-
141
-
142
-
143
-
144
-
145
-
146
-
147
-
148
-
149
-
150
-
151
-
152
-
153
-
154
-
155
-
156
-
157
-
158
-
159
-
160
-
161
-
162
-
163
-
164
-
165
-
166
-
167
-
168
-
169
-
170
-
171
-
172
-
173
-
174
-
175
-
176
-
177
-
178
-
179
-
180
-
181
-
182
-
183
-
184
-
185
-
186
-
187
-
188
-
189
-
190
-
191
-
192
-
193
-
 194
194 -
 195
195 -
 196
196 -
 197
197 -
 198
198 -
 199
199 -
 200
200 -
 201
201 -
 202
202 -
 203
203 -
 204
204 -
 205
205 -
 206
206 -
 207
207 -
 208
208 -
 209
209 -
 210
210 -
 211
211 -
 212
212 -
 213
213 -
 214
214 -
215
-
216
-
217
-
218
-
219
-
220
-
221
-
222
-
223
-
224
-
225
-
226
-
227
-
228
-
229
-
230
-
231
-
232
-
233
-
234
-
235
-
236
-
237
-
238
-
239
-
240
-
241
-
242
-
243
-
244
-
245
-
246
-
247
-
248
-
249
-
250
-
251
-
252
-
253
-
254
-
255
-
256
-
257
-
258
-
259
-
260
-
261
-
262
-
263
-
264
-
265
-
266
-
267
-
268
-
269
-
270
-
271
-
272
-
273
-
274
-
275
-
276
-
277
-
278
-
279
-
280
-
281
-
282
-
283
-
284
-
285
-
286
-
287
-
288
-
289
-
290
-
291
-
292
-
293
-
294
-
295
-
296
-
297
-
298
-
299
-
300
-
301
-
302
-
303
-
304
-
305
-
306
-
307
-
308
-
309
-
310
-
311
-
312
-
313
-
314
-
315
-
316
-
317
-
318
-
319
-
320
-
321
-
322
-
323
-
324
-
325
-
326
-
327
-
328
-
329
-
330
-
331
-
332
-
333
-
334
-
335
-
336
-
337
-
338
-
339
-
340
-
341
-
342
-
343
-
344
-
345
-
346
-
347
-
348
-
349
-
350
-
351
-
352
-
353
-
354
-
355
-
356
-
357
-
358
-
359
-
360
-
361
-
362
-
363
-
364
-
365
-
366
-
367
-
368
-
369
-
370
-
371
-
372
-
373
-
374
-
375
-
376
-
377
-
378
-
379
-
380
-
381
-
382
-
383
-
384
-
385
-
386
-
387
-
388
-
389
-
390
-
391
-
392
-
393
-
394
-
395
-
396
-
397
-
398
-
399
-
400
-
401
-
402
-
403
-
404
-
405
-
406
-
407
-
408
-
409
-
410
-
411
-
412
-
413
-
414
-
415
-
416
-
417
-
418
-
419
-
420
-
421
-
422
-
423
-
424
-
425
-
426
-
427
-
428
-
429
-
430
-
431
-
432
-
433
-
434
-
435
-
436
-
437
-
438
-
439
-
440
-
441
-
442
-
443
-
444
-
445
-
446
-
447
-
448
-
449
-
450
-
451
-
452
-
453
-
454
-
455
-
456
-
457
-
458
 |
 |

HSBC HOLDINGS PLC
Report of the Directors: The Management of Risk (continued)
Credit risk > Provisions for bad and doubtful debts > 2002 / Impairment charges > 2006 / 2005
202
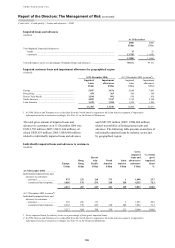
Movement in provisions by industry segment and by geographical region (continued)
(Unaudited
2002 (restated4)
Europe
Hong
Kong
Rest of
Asia-
Pacific
North
America
Latin
America Total
US$m US$m US$m US$m US$m US$m
Provisions at 1 January ....................................... 3,067 1,408 1,952 708 1,048 8,183
Amounts written off
Banks ............................................................... – – – – (1) (1)
Commercial, industrial and international trade (161) (59) (255) (86) (34) (595)
Real estate ........................................................ (31) (18) (88) (9) (4) (150)
Non-bank financial institutions ....................... (4) (11) (2) (12) (2) (31)
Governments ................................................... (1) – – – – (1)
Other commercial ............................................ (54) (11) (116) (149) (22) (352)
Residential mortgages ..................................... (2) (109) (7) (2) (10) (130)
Other personal ................................................. (199) (328) (132) (96) (96) (851)
(452) (536) (600) (354) (169) (2,111)
Recoveries of amounts written off in previous
years
Commercial, industrial and international trade 15 1 4 6 2 28
Real estate ........................................................ 6 – 2 6 – 14
Non-bank financial institutions ....................... – – 1 – – 1
Other commercial ............................................ 7 3 14 9 – 33
Residential mortgages ..................................... 1 7 – – – 8
Other personal ................................................. 29 14 31 14 8 96
58 25 52 35 10 180
Net charge to profit and loss account1
Banks ............................................................... (2) – – – – (2)
Commercial, industrial and international trade 345 (22) 38 78 41 480
Real estate ........................................................ (4) 9 (11) 5 2 1
Non-bank financial institutions ....................... 3 (14) (29) 18 11 (11)
Governments ................................................... (1) – – (5) 4 (2)
Other commercial ............................................ 50 (22) (22) 115 178 299
Residential mortgages ..................................... – 70 11 (4) 10 87
Other personal ................................................. 243 322 93 66 96 820
General provisions ........................................... (65) (97) 9 (32) (166) (351)
569 246 89 241 176 1,321
Foreign exchange and other movements2 ........... 426 – 3 12 1,126 1,567
Provisions at 31 December ................................. 3,668 1,143 1,496 642 2,191 9,140
Provisions against banks:
– specific provisions ........................................ 23 – – – – 23
Provisions against customers:
– specific provisions ........................................ 2,774 688 1,321 222 1,601 6,606
– general provisions3 ....................................... 871 455 175 420 590 2,511
Provisions at 31 December ................................. 3,668 1,143 1,496 642 2,191 9,140
% % % % % %
Provisions against customers as a percentage
of loans and advances to customers:
– specific provisions ........................................ 1.65 0.97 3.42 0.32 11.25 1.83
– general provisions ........................................ 0.52 0.64 0.45 0.61 4.15 0.69
At 31 December .................................................. 2.17 1.61 3.87 0.93 15.40 2.52
1 See table below ‘Net charge to the profit and loss account for bad and doubtful debts by geographical region’.
2 Other movements include amounts transferred in on the acquisition of HSBC Mexico of US$1,704 million.
3 General provisions are allocated to geographical segments based on the location of the office booking the provision. Consequently, the
general provision booked in Hong Kong may cover assets booked in branches located outside Hong Kong, principally in the Rest of
Asia-Pacific, as well as those booked in Hong Kong.
4 In 2006, Mexico and Panama were reclassified from the North America segment to the Latin America segment. Comparative
information has been restated accordingly. See Note 13 on the Financial Statements.