HSBC 2006 Annual Report Download - page 139
Download and view the complete annual report
Please find page 139 of the 2006 HSBC annual report below. You can navigate through the pages in the report by either clicking on the pages listed below, or by using the keyword search tool below to find specific information within the annual report.-
 1
1 -
2
-
3
-
4
-
5
-
6
-
7
-
8
-
9
-
10
-
11
-
12
-
13
-
14
-
15
-
16
-
17
-
18
-
19
-
20
-
21
-
22
-
23
-
24
-
25
-
26
-
27
-
28
-
29
-
30
-
31
-
32
-
33
-
34
-
35
-
36
-
37
-
38
-
39
-
40
-
41
-
42
-
43
-
44
-
45
-
46
-
47
-
48
-
49
-
50
-
51
-
52
-
53
-
54
-
55
-
56
-
57
-
58
-
59
-
60
-
61
-
62
-
63
-
64
-
65
-
66
-
67
-
68
-
69
-
70
-
71
-
72
-
73
-
74
-
75
-
76
-
77
-
78
-
79
-
80
-
81
-
82
-
83
-
84
-
85
-
86
-
87
-
88
-
89
-
90
-
91
-
92
-
93
-
94
-
95
-
96
-
97
-
98
-
99
-
100
-
101
-
102
-
103
-
104
-
105
-
106
-
107
-
108
-
109
-
110
-
111
-
112
-
113
-
114
-
115
-
116
-
117
-
118
-
119
-
120
-
121
-
122
-
123
-
124
-
125
-
126
-
127
-
128
-
 129
129 -
 130
130 -
 131
131 -
 132
132 -
 133
133 -
 134
134 -
 135
135 -
 136
136 -
 137
137 -
 138
138 -
 139
139 -
 140
140 -
 141
141 -
 142
142 -
 143
143 -
 144
144 -
 145
145 -
 146
146 -
 147
147 -
 148
148 -
 149
149 -
150
-
151
-
152
-
153
-
154
-
155
-
156
-
157
-
158
-
159
-
160
-
161
-
162
-
163
-
164
-
165
-
166
-
167
-
168
-
169
-
170
-
171
-
172
-
173
-
174
-
175
-
176
-
177
-
178
-
179
-
180
-
181
-
182
-
183
-
184
-
185
-
186
-
187
-
188
-
189
-
190
-
191
-
192
-
193
-
194
-
195
-
196
-
197
-
198
-
199
-
200
-
201
-
202
-
203
-
204
-
205
-
206
-
207
-
208
-
209
-
210
-
211
-
212
-
213
-
214
-
215
-
216
-
217
-
218
-
219
-
220
-
221
-
222
-
223
-
224
-
225
-
226
-
227
-
228
-
229
-
230
-
231
-
232
-
233
-
234
-
235
-
236
-
237
-
238
-
239
-
240
-
241
-
242
-
243
-
244
-
245
-
246
-
247
-
248
-
249
-
250
-
251
-
252
-
253
-
254
-
255
-
256
-
257
-
258
-
259
-
260
-
261
-
262
-
263
-
264
-
265
-
266
-
267
-
268
-
269
-
270
-
271
-
272
-
273
-
274
-
275
-
276
-
277
-
278
-
279
-
280
-
281
-
282
-
283
-
284
-
285
-
286
-
287
-
288
-
289
-
290
-
291
-
292
-
293
-
294
-
295
-
296
-
297
-
298
-
299
-
300
-
301
-
302
-
303
-
304
-
305
-
306
-
307
-
308
-
309
-
310
-
311
-
312
-
313
-
314
-
315
-
316
-
317
-
318
-
319
-
320
-
321
-
322
-
323
-
324
-
325
-
326
-
327
-
328
-
329
-
330
-
331
-
332
-
333
-
334
-
335
-
336
-
337
-
338
-
339
-
340
-
341
-
342
-
343
-
344
-
345
-
346
-
347
-
348
-
349
-
350
-
351
-
352
-
353
-
354
-
355
-
356
-
357
-
358
-
359
-
360
-
361
-
362
-
363
-
364
-
365
-
366
-
367
-
368
-
369
-
370
-
371
-
372
-
373
-
374
-
375
-
376
-
377
-
378
-
379
-
380
-
381
-
382
-
383
-
384
-
385
-
386
-
387
-
388
-
389
-
390
-
391
-
392
-
393
-
394
-
395
-
396
-
397
-
398
-
399
-
400
-
401
-
402
-
403
-
404
-
405
-
406
-
407
-
408
-
409
-
410
-
411
-
412
-
413
-
414
-
415
-
416
-
417
-
418
-
419
-
420
-
421
-
422
-
423
-
424
-
425
-
426
-
427
-
428
-
429
-
430
-
431
-
432
-
433
-
434
-
435
-
436
-
437
-
438
-
439
-
440
-
441
-
442
-
443
-
444
-
445
-
446
-
447
-
448
-
449
-
450
-
451
-
452
-
453
-
454
-
455
-
456
-
457
-
458
 |
 |

137
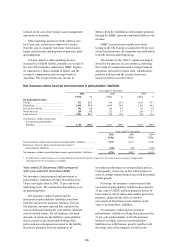
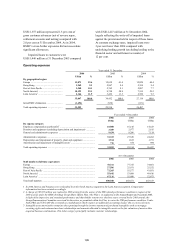
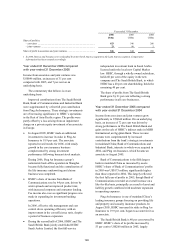
Year ended 31 December
2006
US$m
2005
US$m
2004
US$m
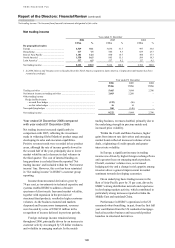
Loan impairment charges1
New allowances net of allowance releases ................................................. 11,326 8,354 7,606
Recoveries of amounts previously written off ............................................ (779) (494) (913)
10,547 7,860 6,693
Individually assessed allowances .................................................................... 458 518 –
Collectively assessed allowances .................................................................... 10,089 7,342 –
General provisions ........................................................................................... – – (498)
Other credit risk provisions ............................................................................. 26 (59) (4)
Total loan impairment charges and other credit risk provisions ..................... 10,573 7,801 6,191
Customer impaired loans ................................................................................. 13,785 11,446 12,427
Customer loan impairment allowances ........................................................... 13,578 11,357 12,542
1 Loan impairment charges in 2004 refer to specific provisions.
Year ended 31 December 2006 compared
with year ended 31 December 2005
The charge for loan impairments and other credit
risk provisions was US$10,573 million, a 36 per cent
increase over that reported in 2005. The analysis that
follows is on an underlying basis.
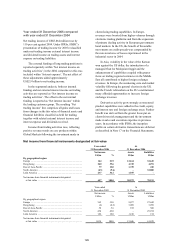
On an underlying basis, charges increased by
30 per cent. This reflected:
• increased loss experience in the US mortgage
services business, particularly in second lien,
portions of first lien and adjustable rate
mortgages acquired from correspondent brokers
and banks in 2005 and in the first half of 2006;
• 10 per cent underlying lending growth
(excluding lending to the financial sector and
settlement accounts), notably in the UK, the US,
Mexico, Brazil and Asia;
• the continuing effect in the UK of consumer
recourse to formal debt mitigation
arrangements;
• credit deterioration, principally in the first half
of 2006, in unsecured personal and credit card
lending in Taiwan and Indonesia; offset by
• the non-recurrence of a surge in bankruptcy
filings in the US in the fourth quarter of 2005
and the effect of hurricane Katrina; and
• a continued benign commercial and corporate
credit environment.
In Europe, net loan impairment charges rose by
10 per cent to US$2,155 million. In the UK, net
charges rose by a modest 4 per cent as growth in the
personal customer impairment charge, which was
broadly in line with lending growth, was partially
offset by favourable movements on the impairment
charge for commercial loans in a robust corporate
credit environment. The personal sector continued to
experience higher levels of IVA and bankruptcy
filings, following an easing of bankruptcy
regulations in 2004, growth in consumer
indebtedness and a rise in unemployment. This was
mitigated by action taken on underwriting and
collections. In France, the non-recurrence of several
significant recoveries in 2005 resulted in an increase
in net loan impairment charges in 2006.
Loan impairment charges in Hong Kong
remained low at US$172 million, underpinned by
robust personal and commercial credit quality in a
strong economy with low unemployment.
In the Rest of Asia-Pacific, loan impairment
charges rose sharply to US$512 million. Taiwan and
Indonesia experienced credit deterioration during
2006, although the problem peaked in the first half
of the year. Taiwan was affected by the imposition
of a mandatory government debt renegotiation
scheme which allowed customers to extend and
heavily discount repayment terms, leading to
market-wide credit losses. Indonesia was also
affected by regulations, specifically with respect to
minimum re-payment terms which compounded
higher impairments brought about by a reduction in
fuel subsidies. Elsewhere in the Rest of Asia-Pacific
credit quality was stable.
In North America, the net loan impairment
charge increased significantly, by 32 per cent to
US$6,796 million, largely in the second half of
2006, driven by the credit deterioration in US sub-
prime mortgages described in the first bullet point
above. The effects of the decline in US house price
inflation and rising interest rates during 2006 were
accentuated by the increased percentage of second
lien loan originations to total loans originated in
2005 and the first half of 2006, and the underwriting
of stated income (low documentation) products. The
US net loan impairment charges increased by 37 per
cent after taking into account the most recent trends