HSBC 2006 Annual Report Download - page 197
Download and view the complete annual report
Please find page 197 of the 2006 HSBC annual report below. You can navigate through the pages in the report by either clicking on the pages listed below, or by using the keyword search tool below to find specific information within the annual report.-
 1
1 -
2
-
3
-
4
-
5
-
6
-
7
-
8
-
9
-
10
-
11
-
12
-
13
-
14
-
15
-
16
-
17
-
18
-
19
-
20
-
21
-
22
-
23
-
24
-
25
-
26
-
27
-
28
-
29
-
30
-
31
-
32
-
33
-
34
-
35
-
36
-
37
-
38
-
39
-
40
-
41
-
42
-
43
-
44
-
45
-
46
-
47
-
48
-
49
-
50
-
51
-
52
-
53
-
54
-
55
-
56
-
57
-
58
-
59
-
60
-
61
-
62
-
63
-
64
-
65
-
66
-
67
-
68
-
69
-
70
-
71
-
72
-
73
-
74
-
75
-
76
-
77
-
78
-
79
-
80
-
81
-
82
-
83
-
84
-
85
-
86
-
87
-
88
-
89
-
90
-
91
-
92
-
93
-
94
-
95
-
96
-
97
-
98
-
99
-
100
-
101
-
102
-
103
-
104
-
105
-
106
-
107
-
108
-
109
-
110
-
111
-
112
-
113
-
114
-
115
-
116
-
117
-
118
-
119
-
120
-
121
-
122
-
123
-
124
-
125
-
126
-
127
-
128
-
129
-
130
-
131
-
132
-
133
-
134
-
135
-
136
-
137
-
138
-
139
-
140
-
141
-
142
-
143
-
144
-
145
-
146
-
147
-
148
-
149
-
150
-
151
-
152
-
153
-
154
-
155
-
156
-
157
-
158
-
159
-
160
-
161
-
162
-
163
-
164
-
165
-
166
-
167
-
168
-
169
-
170
-
171
-
172
-
173
-
174
-
175
-
176
-
177
-
178
-
179
-
180
-
181
-
182
-
183
-
184
-
185
-
186
-
 187
187 -
 188
188 -
 189
189 -
 190
190 -
 191
191 -
 192
192 -
 193
193 -
 194
194 -
 195
195 -
 196
196 -
 197
197 -
 198
198 -
 199
199 -
 200
200 -
 201
201 -
 202
202 -
 203
203 -
 204
204 -
 205
205 -
 206
206 -
 207
207 -
208
-
209
-
210
-
211
-
212
-
213
-
214
-
215
-
216
-
217
-
218
-
219
-
220
-
221
-
222
-
223
-
224
-
225
-
226
-
227
-
228
-
229
-
230
-
231
-
232
-
233
-
234
-
235
-
236
-
237
-
238
-
239
-
240
-
241
-
242
-
243
-
244
-
245
-
246
-
247
-
248
-
249
-
250
-
251
-
252
-
253
-
254
-
255
-
256
-
257
-
258
-
259
-
260
-
261
-
262
-
263
-
264
-
265
-
266
-
267
-
268
-
269
-
270
-
271
-
272
-
273
-
274
-
275
-
276
-
277
-
278
-
279
-
280
-
281
-
282
-
283
-
284
-
285
-
286
-
287
-
288
-
289
-
290
-
291
-
292
-
293
-
294
-
295
-
296
-
297
-
298
-
299
-
300
-
301
-
302
-
303
-
304
-
305
-
306
-
307
-
308
-
309
-
310
-
311
-
312
-
313
-
314
-
315
-
316
-
317
-
318
-
319
-
320
-
321
-
322
-
323
-
324
-
325
-
326
-
327
-
328
-
329
-
330
-
331
-
332
-
333
-
334
-
335
-
336
-
337
-
338
-
339
-
340
-
341
-
342
-
343
-
344
-
345
-
346
-
347
-
348
-
349
-
350
-
351
-
352
-
353
-
354
-
355
-
356
-
357
-
358
-
359
-
360
-
361
-
362
-
363
-
364
-
365
-
366
-
367
-
368
-
369
-
370
-
371
-
372
-
373
-
374
-
375
-
376
-
377
-
378
-
379
-
380
-
381
-
382
-
383
-
384
-
385
-
386
-
387
-
388
-
389
-
390
-
391
-
392
-
393
-
394
-
395
-
396
-
397
-
398
-
399
-
400
-
401
-
402
-
403
-
404
-
405
-
406
-
407
-
408
-
409
-
410
-
411
-
412
-
413
-
414
-
415
-
416
-
417
-
418
-
419
-
420
-
421
-
422
-
423
-
424
-
425
-
426
-
427
-
428
-
429
-
430
-
431
-
432
-
433
-
434
-
435
-
436
-
437
-
438
-
439
-
440
-
441
-
442
-
443
-
444
-
445
-
446
-
447
-
448
-
449
-
450
-
451
-
452
-
453
-
454
-
455
-
456
-
457
-
458
 |
 |
195
Year ended 31 December 2006 compared
with year ended 31 December 2005
(Unaudited)
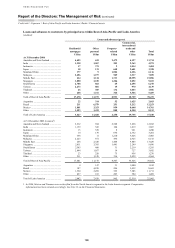
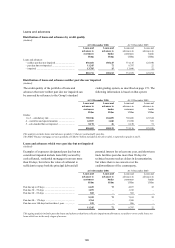
Total impaired loans to customers were
US$13,785 million at 31 December 2006, an
increase of 20 per cent since the end of 2005. At
constant currency the growth was 14 per cent and, at
31 December 2006, impaired loans as a percentage
of gross customer loans and advances were 1.56 per
cent (2005: 1.52 per cent). The US represented
9 percentage points of overall growth and 33 per
cent of total impaired customer loans at
31 December 2006.
The commentary that follows is based on
constant exchange rates.
In Europe, impaired loans rose by 4 per cent to
US$5,847 million in 2006. In the UK, impaired
loans grew by 11 per cent over the same period. The
UK market remained challenging, with pressure on
consumers through high levels of personal
indebtedness, compounded by interest rate rises.
These effects were to an extent masked by the
growing prevalence of personal bankruptcies and
IVAs, at the completion of which any unpaid
balances are written off. UK commercial and
corporate lending remained broadly stable. In
France, impaired loans fell mainly as a result of
more active portfolio management, including the
sale of a portfolio of substantially impaired debt and,
in Turkey, higher impaired balances were broadly in
line with growth in customer advances; the credit
environment in these countries was relatively stable.
Impaired loans in Hong Kong were 10 per cent
lower at US$454 million at 31 December 2006.
HSBC responded to moderate volatility in its loan
portfolio by launching a number of initiatives to
strengthen credit management and risk monitoring
procedures, in order to improve the credit quality of
its portfolio. As a result, the number of newly
impaired loans fell and an increased number of loans
were written off.
In the Rest of Asia-Pacific, impaired loans
increased by 23 per cent to US$1,184 million. In
Taiwan, delinquency problems emerged in the
middle of 2005, centred on a relatively small number
of highly leveraged consumers. This prompted a
range of regulatory changes aimed at avoiding a
financial crisis, the most significant being the
introduction of a government debt negotiation
mechanism by which banks were instructed to make
available deferred repayment terms at discounted
rates. The consequence of this was to widen
considerably the group of debtors seeking relief and
increase substantially HSBC’s impaired loans to
some US$340 million. In the Middle East, the 8 per
cent rise in impaired loans reflected lending growth.
Impaired loans declined in most other countries,
reflecting buoyant regional economies.
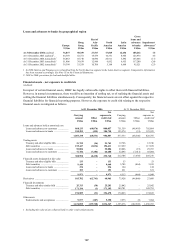
In North America there was a rise of 30 per
cent in impaired loans, to US$4,822 million at
31 December 2006. Growth was substantially driven
by credit deterioration in second lien, some portions
of first lien and adjustable-rate mortgages in the US
mortgage services book, as detailed on page 189.
This was partly offset by the non-recurrence of
significant loan impairment allowances which were
raised in 2005 as a result of hurricane Katrina and
increased levels of bankruptcy filings in the fourth
quarter of the year. As a consequence of this latter
factor, HSBC experienced bankruptcies significantly
below long-term trends in the first half of 2006.
Continuing assessments of the financial impact of
hurricane Katrina on HSBC Finance’s customers
living in the Katrina Federal Emergency
Management Agency designated Individual
Assistance disaster areas resulted in a downwards
revision of the estimate of credit loss exposure in the
first half of 2006.
In contrast to the accelerated credit weakness
witnessed in the mortgage services business, the
trend of credit delinquency across the majority of the
other portfolios, including mortgage balances
originated through the branch-based consumer
lending business, rose modestly, driven by growing
portfolio maturity and a higher mix of credit card
receivables following the Metris acquisition.
In Canada, impaired loans increased as a
small number of commercial customers in the
manufacturing sector were adversely affected by
the stronger Canadian dollar.
In Latin America, impaired loans increased by
14 per cent to US$1,478 million, partly due to
acquisitions in 2006 and partly to a higher amount of
personal lending. Growth was mainly in Mexico and
Brazil. In Mexico, impaired loans rose through
strong growth in lending to personal and commercial
customers, particularly the small and middle market
sectors. In Brazil, impaired loans rose by 6 per cent,
reflecting lending growth and some continuing credit
stress, in part mitigated through tightened
underwriting criteria introduced during 2005 and
2006.