HSBC 2006 Annual Report Download - page 4
Download and view the complete annual report
Please find page 4 of the 2006 HSBC annual report below. You can navigate through the pages in the report by either clicking on the pages listed below, or by using the keyword search tool below to find specific information within the annual report.-
 1
1 -
 2
2 -
 3
3 -
 4
4 -
 5
5 -
 6
6 -
 7
7 -
 8
8 -
 9
9 -
 10
10 -
 11
11 -
 12
12 -
 13
13 -
 14
14 -
 15
15 -
16
-
17
-
18
-
19
-
20
-
21
-
22
-
23
-
24
-
25
-
26
-
27
-
28
-
29
-
30
-
31
-
32
-
33
-
34
-
35
-
36
-
37
-
38
-
39
-
40
-
41
-
42
-
43
-
44
-
45
-
46
-
47
-
48
-
49
-
50
-
51
-
52
-
53
-
54
-
55
-
56
-
57
-
58
-
59
-
60
-
61
-
62
-
63
-
64
-
65
-
66
-
67
-
68
-
69
-
70
-
71
-
72
-
73
-
74
-
75
-
76
-
77
-
78
-
79
-
80
-
81
-
82
-
83
-
84
-
85
-
86
-
87
-
88
-
89
-
90
-
91
-
92
-
93
-
94
-
95
-
96
-
97
-
98
-
99
-
100
-
101
-
102
-
103
-
104
-
105
-
106
-
107
-
108
-
109
-
110
-
111
-
112
-
113
-
114
-
115
-
116
-
117
-
118
-
119
-
120
-
121
-
122
-
123
-
124
-
125
-
126
-
127
-
128
-
129
-
130
-
131
-
132
-
133
-
134
-
135
-
136
-
137
-
138
-
139
-
140
-
141
-
142
-
143
-
144
-
145
-
146
-
147
-
148
-
149
-
150
-
151
-
152
-
153
-
154
-
155
-
156
-
157
-
158
-
159
-
160
-
161
-
162
-
163
-
164
-
165
-
166
-
167
-
168
-
169
-
170
-
171
-
172
-
173
-
174
-
175
-
176
-
177
-
178
-
179
-
180
-
181
-
182
-
183
-
184
-
185
-
186
-
187
-
188
-
189
-
190
-
191
-
192
-
193
-
194
-
195
-
196
-
197
-
198
-
199
-
200
-
201
-
202
-
203
-
204
-
205
-
206
-
207
-
208
-
209
-
210
-
211
-
212
-
213
-
214
-
215
-
216
-
217
-
218
-
219
-
220
-
221
-
222
-
223
-
224
-
225
-
226
-
227
-
228
-
229
-
230
-
231
-
232
-
233
-
234
-
235
-
236
-
237
-
238
-
239
-
240
-
241
-
242
-
243
-
244
-
245
-
246
-
247
-
248
-
249
-
250
-
251
-
252
-
253
-
254
-
255
-
256
-
257
-
258
-
259
-
260
-
261
-
262
-
263
-
264
-
265
-
266
-
267
-
268
-
269
-
270
-
271
-
272
-
273
-
274
-
275
-
276
-
277
-
278
-
279
-
280
-
281
-
282
-
283
-
284
-
285
-
286
-
287
-
288
-
289
-
290
-
291
-
292
-
293
-
294
-
295
-
296
-
297
-
298
-
299
-
300
-
301
-
302
-
303
-
304
-
305
-
306
-
307
-
308
-
309
-
310
-
311
-
312
-
313
-
314
-
315
-
316
-
317
-
318
-
319
-
320
-
321
-
322
-
323
-
324
-
325
-
326
-
327
-
328
-
329
-
330
-
331
-
332
-
333
-
334
-
335
-
336
-
337
-
338
-
339
-
340
-
341
-
342
-
343
-
344
-
345
-
346
-
347
-
348
-
349
-
350
-
351
-
352
-
353
-
354
-
355
-
356
-
357
-
358
-
359
-
360
-
361
-
362
-
363
-
364
-
365
-
366
-
367
-
368
-
369
-
370
-
371
-
372
-
373
-
374
-
375
-
376
-
377
-
378
-
379
-
380
-
381
-
382
-
383
-
384
-
385
-
386
-
387
-
388
-
389
-
390
-
391
-
392
-
393
-
394
-
395
-
396
-
397
-
398
-
399
-
400
-
401
-
402
-
403
-
404
-
405
-
406
-
407
-
408
-
409
-
410
-
411
-
412
-
413
-
414
-
415
-
416
-
417
-
418
-
419
-
420
-
421
-
422
-
423
-
424
-
425
-
426
-
427
-
428
-
429
-
430
-
431
-
432
-
433
-
434
-
435
-
436
-
437
-
438
-
439
-
440
-
441
-
442
-
443
-
444
-
445
-
446
-
447
-
448
-
449
-
450
-
451
-
452
-
453
-
454
-
455
-
456
-
457
-
458
 |
 |

HSBC HOLDINGS PLC
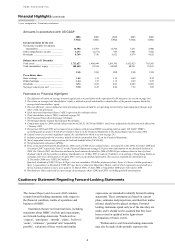
Financial Highlights (continued)
Ratios / 5-year comparison
2
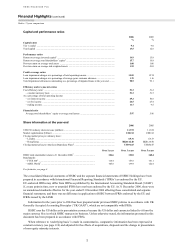
Capital and performance ratios
2006 2005
% %
Capital ratios
Tier 1 capital ...................................................................................................................................... 9.4 9.0
Total capital ....................................................................................................................................... 13.5 12.8
Performance ratios
Return on average invested capital1 ................................................................................................... 14.9 15.9
Return on average total shareholders’ equity2 ................................................................................... 15.7 16.8
Post-tax return on average total assets .............................................................................................. 1.00 1.06
Post-tax return on average risk-weighted assets ............................................................................... 1.93 2.01
Credit coverage ratios
Loan impairment charges as a percentage of total operating income ............................................... 15.05 12.74
Loan impairment charges as a percentage of average gross customer advances .............................. 1.39 1.16
Total impairment allowances outstanding as a percentage of impaired loans at the year-end ......... 98.5 99.1
Efficiency and revenue mix ratios
Cost efficiency ratio3 ......................................................................................................................... 51.3 51.2
– constant currency basis .............................................................................................................. 51.3 51.3
As a percentage of total operating income:
– net interest income ..................................................................................................................... 49.2 50.8
– net fee income ............................................................................................................................ 24.5 23.4
– trading income ............................................................................................................................ 11.7 9.5
Financial ratio
Average total shareholders’ equity to average total assets ........................................................... 5.97 5.96
Share information at the year-end
2006 2005
US$0.50 ordinary shares in issue (million) ....................................................................................... 11,572 11,334
Market capitalisation (billion) ........................................................................................................... US$212 US$182
Closing market price per ordinary share:
– London ........................................................................................................................................ £9.31 £9.33
– Hong Kong ................................................................................................................................. HK$142.40 HK$124.50
Closing market price per American Depositary Share4 ..................................................................... US$91.65 US$80.47
Over 1 year Over 3 years Over 5 years
HSBC total shareholder return to 31 December 20065 ................................... 104.6 122.0 148.4
Benchmarks:
– FTSE 1006 ................................................................................................ 114.4 153.8 141.1
– MSCI World7 ............................................................................................ 105.8 139.9 122.4
For footnotes, see page 4.
The consolidated financial statements of HSBC and the separate financial statements of HSBC Holdings have been
prepared in accordance with International Financial Reporting Standards (‘IFRSs’) as endorsed by the EU.
EU-endorsed IFRSs may differ from IFRSs as published by the International Accounting Standards Board (‘IASB’)
if, at any point in time, new or amended IFRSs have not been endorsed by the EU. At 31 December 2006, there were
no unendorsed standards effective for the year ended 31 December 2006 affecting these consolidated and separate
financial statements, and there was no difference in application to HSBC between IFRSs endorsed by the EU and
IFRSs issued by the IASB.
Information for the years prior to 2004 has been prepared under previous HSBC policies in accordance with UK
Generally Accepted Accounting Principles (‘UK GAAP’), which are not comparable with IFRSs.
HSBC uses the US dollar as its presentation currency because the US dollar and currencies linked to it form the
major currency bloc in which HSBC transacts its business. Unless otherwise stated, the information presented in this
document has been prepared in accordance with IFRSs.
When reference to ‘underlying basis’ is made in commentaries, comparative information has been expressed at
constant currency (see page 110) and adjusted for the effects of acquisitions, disposals and the change in presentation
of non-equity minority interests.