HSBC 2006 Annual Report Download - page 74
Download and view the complete annual report
Please find page 74 of the 2006 HSBC annual report below. You can navigate through the pages in the report by either clicking on the pages listed below, or by using the keyword search tool below to find specific information within the annual report.-
 1
1 -
2
-
3
-
4
-
5
-
6
-
7
-
8
-
9
-
10
-
11
-
12
-
13
-
14
-
15
-
16
-
17
-
18
-
19
-
20
-
21
-
22
-
23
-
24
-
25
-
26
-
27
-
28
-
29
-
30
-
31
-
32
-
33
-
34
-
35
-
36
-
37
-
38
-
39
-
40
-
41
-
42
-
43
-
44
-
45
-
46
-
47
-
48
-
49
-
50
-
51
-
52
-
53
-
54
-
55
-
56
-
57
-
58
-
59
-
60
-
61
-
62
-
63
-
 64
64 -
 65
65 -
 66
66 -
 67
67 -
 68
68 -
 69
69 -
 70
70 -
 71
71 -
 72
72 -
 73
73 -
 74
74 -
 75
75 -
 76
76 -
 77
77 -
 78
78 -
 79
79 -
 80
80 -
 81
81 -
 82
82 -
 83
83 -
 84
84 -
85
-
86
-
87
-
88
-
89
-
90
-
91
-
92
-
93
-
94
-
95
-
96
-
97
-
98
-
99
-
100
-
101
-
102
-
103
-
104
-
105
-
106
-
107
-
108
-
109
-
110
-
111
-
112
-
113
-
114
-
115
-
116
-
117
-
118
-
119
-
120
-
121
-
122
-
123
-
124
-
125
-
126
-
127
-
128
-
129
-
130
-
131
-
132
-
133
-
134
-
135
-
136
-
137
-
138
-
139
-
140
-
141
-
142
-
143
-
144
-
145
-
146
-
147
-
148
-
149
-
150
-
151
-
152
-
153
-
154
-
155
-
156
-
157
-
158
-
159
-
160
-
161
-
162
-
163
-
164
-
165
-
166
-
167
-
168
-
169
-
170
-
171
-
172
-
173
-
174
-
175
-
176
-
177
-
178
-
179
-
180
-
181
-
182
-
183
-
184
-
185
-
186
-
187
-
188
-
189
-
190
-
191
-
192
-
193
-
194
-
195
-
196
-
197
-
198
-
199
-
200
-
201
-
202
-
203
-
204
-
205
-
206
-
207
-
208
-
209
-
210
-
211
-
212
-
213
-
214
-
215
-
216
-
217
-
218
-
219
-
220
-
221
-
222
-
223
-
224
-
225
-
226
-
227
-
228
-
229
-
230
-
231
-
232
-
233
-
234
-
235
-
236
-
237
-
238
-
239
-
240
-
241
-
242
-
243
-
244
-
245
-
246
-
247
-
248
-
249
-
250
-
251
-
252
-
253
-
254
-
255
-
256
-
257
-
258
-
259
-
260
-
261
-
262
-
263
-
264
-
265
-
266
-
267
-
268
-
269
-
270
-
271
-
272
-
273
-
274
-
275
-
276
-
277
-
278
-
279
-
280
-
281
-
282
-
283
-
284
-
285
-
286
-
287
-
288
-
289
-
290
-
291
-
292
-
293
-
294
-
295
-
296
-
297
-
298
-
299
-
300
-
301
-
302
-
303
-
304
-
305
-
306
-
307
-
308
-
309
-
310
-
311
-
312
-
313
-
314
-
315
-
316
-
317
-
318
-
319
-
320
-
321
-
322
-
323
-
324
-
325
-
326
-
327
-
328
-
329
-
330
-
331
-
332
-
333
-
334
-
335
-
336
-
337
-
338
-
339
-
340
-
341
-
342
-
343
-
344
-
345
-
346
-
347
-
348
-
349
-
350
-
351
-
352
-
353
-
354
-
355
-
356
-
357
-
358
-
359
-
360
-
361
-
362
-
363
-
364
-
365
-
366
-
367
-
368
-
369
-
370
-
371
-
372
-
373
-
374
-
375
-
376
-
377
-
378
-
379
-
380
-
381
-
382
-
383
-
384
-
385
-
386
-
387
-
388
-
389
-
390
-
391
-
392
-
393
-
394
-
395
-
396
-
397
-
398
-
399
-
400
-
401
-
402
-
403
-
404
-
405
-
406
-
407
-
408
-
409
-
410
-
411
-
412
-
413
-
414
-
415
-
416
-
417
-
418
-
419
-
420
-
421
-
422
-
423
-
424
-
425
-
426
-
427
-
428
-
429
-
430
-
431
-
432
-
433
-
434
-
435
-
436
-
437
-
438
-
439
-
440
-
441
-
442
-
443
-
444
-
445
-
446
-
447
-
448
-
449
-
450
-
451
-
452
-
453
-
454
-
455
-
456
-
457
-
458
 |
 |

HSBC HOLDINGS PLC
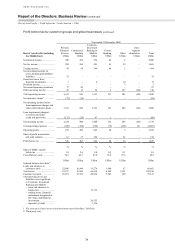
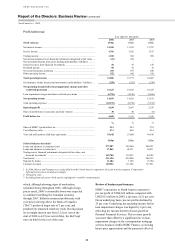
Report of the Directors: Business Review (continued)
Rest of Asia-Pacific > Profit before tax
72
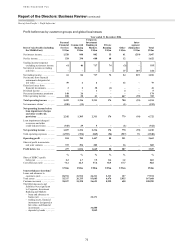
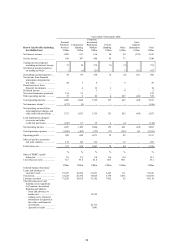
Profit before tax by customer groups and global businesses
Year ended 31 December 2006
Rest of Asia-Pacific (including
the Middle East)
Personal
Financial
Services
US$m
Commercial
Banking
US$m
Corporate,
Investment
Banking &
Markets
US$m
Private
Banking
US$m
Other
US$m
Inter-
segment
elimination
US$m
Total
US$m
Net interest income ..................... 1,520 848 802 35 61 (219) 3,047
Net fee income ............................ 524 330 688 68 12 – 1,622
Trading income/(expense)
excluding net interest income 61 86 717 74 (3) – 935
Net interest income on trading
activities .................................. – –––27 219 246
Net trading income ..................... 61 86 717 74 24 219 1,181
Net income from financial
instruments designated at
fair value ................................. 59 4 4 – 12 – 79
Gains less losses from
financial investments .............. 2 2 38 (1) – – 41
Dividend income ......................... – – 1 – 4 – 5
Net earned insurance premiums . 148 26 – – – – 174
Other operating income .............. 108 20 61 – 667 (91) 765
Total operating income ............ 2,422 1,316 2,311 176 780 (91) 6,914
Net insurance claims1 .................. (180) (11) – – (1) – (192)
Net operating income before
loan impairment charges
and other credit risk
provisions .............................. 2,242 1,305 2,311 176 779 (91) 6,722
Loan impairment (charges)/
recoveries and other
credit risk provisions .............. (545) 29 5 – (1) – (512)
Net operating income ............... 1,697 1,334 2,316 176 778 (91) 6,210
Total operating expenses ............ (1,593) (554) (869) (96) (527) 91 (3,548)
Operating profit ........................ 104 780 1,447 80 251 – 2,662
Share of profit in associates
and joint ventures ................... 373 254 202 – 36 – 865
Profit before tax ........................ 477 1,034 1,649 80 287 – 3,527
% % % % % %
Share of HSBC’s profit
before tax ................................ 2.2 4.7 7.5 0.4 1.2 16.0
Cost efficiency ratio ................... 71.1 42.5 37.6 54.5 67.7 52.8
US$m US$m US$m US$m US$m US$m
Selected balance sheet data2
Loans and advances to
customers (net) ....................... 28,911 21,912 24,311 2,313 127 77,574
Total assets ................................. 35,317 26,335 93,605 6,476 5,935 167,668
Customer accounts ...................... 38,557 24,228 36,623 8,929 658 108,995
The following assets and
liabilities were significant
to Corporate, Investment
Banking and Markets:
– loans and advances to
banks (net) .......................... 22,171
– trading assets, financial
instruments designated at
fair value, and financial
investments ......................... 36,580
– deposits by banks ............... 9,849