HSBC 2006 Annual Report Download - page 142
Download and view the complete annual report
Please find page 142 of the 2006 HSBC annual report below. You can navigate through the pages in the report by either clicking on the pages listed below, or by using the keyword search tool below to find specific information within the annual report.-
 1
1 -
2
-
3
-
4
-
5
-
6
-
7
-
8
-
9
-
10
-
11
-
12
-
13
-
14
-
15
-
16
-
17
-
18
-
19
-
20
-
21
-
22
-
23
-
24
-
25
-
26
-
27
-
28
-
29
-
30
-
31
-
32
-
33
-
34
-
35
-
36
-
37
-
38
-
39
-
40
-
41
-
42
-
43
-
44
-
45
-
46
-
47
-
48
-
49
-
50
-
51
-
52
-
53
-
54
-
55
-
56
-
57
-
58
-
59
-
60
-
61
-
62
-
63
-
64
-
65
-
66
-
67
-
68
-
69
-
70
-
71
-
72
-
73
-
74
-
75
-
76
-
77
-
78
-
79
-
80
-
81
-
82
-
83
-
84
-
85
-
86
-
87
-
88
-
89
-
90
-
91
-
92
-
93
-
94
-
95
-
96
-
97
-
98
-
99
-
100
-
101
-
102
-
103
-
104
-
105
-
106
-
107
-
108
-
109
-
110
-
111
-
112
-
113
-
114
-
115
-
116
-
117
-
118
-
119
-
120
-
121
-
122
-
123
-
124
-
125
-
126
-
127
-
128
-
129
-
130
-
131
-
 132
132 -
 133
133 -
 134
134 -
 135
135 -
 136
136 -
 137
137 -
 138
138 -
 139
139 -
 140
140 -
 141
141 -
 142
142 -
 143
143 -
 144
144 -
 145
145 -
 146
146 -
 147
147 -
 148
148 -
 149
149 -
 150
150 -
 151
151 -
 152
152 -
153
-
154
-
155
-
156
-
157
-
158
-
159
-
160
-
161
-
162
-
163
-
164
-
165
-
166
-
167
-
168
-
169
-
170
-
171
-
172
-
173
-
174
-
175
-
176
-
177
-
178
-
179
-
180
-
181
-
182
-
183
-
184
-
185
-
186
-
187
-
188
-
189
-
190
-
191
-
192
-
193
-
194
-
195
-
196
-
197
-
198
-
199
-
200
-
201
-
202
-
203
-
204
-
205
-
206
-
207
-
208
-
209
-
210
-
211
-
212
-
213
-
214
-
215
-
216
-
217
-
218
-
219
-
220
-
221
-
222
-
223
-
224
-
225
-
226
-
227
-
228
-
229
-
230
-
231
-
232
-
233
-
234
-
235
-
236
-
237
-
238
-
239
-
240
-
241
-
242
-
243
-
244
-
245
-
246
-
247
-
248
-
249
-
250
-
251
-
252
-
253
-
254
-
255
-
256
-
257
-
258
-
259
-
260
-
261
-
262
-
263
-
264
-
265
-
266
-
267
-
268
-
269
-
270
-
271
-
272
-
273
-
274
-
275
-
276
-
277
-
278
-
279
-
280
-
281
-
282
-
283
-
284
-
285
-
286
-
287
-
288
-
289
-
290
-
291
-
292
-
293
-
294
-
295
-
296
-
297
-
298
-
299
-
300
-
301
-
302
-
303
-
304
-
305
-
306
-
307
-
308
-
309
-
310
-
311
-
312
-
313
-
314
-
315
-
316
-
317
-
318
-
319
-
320
-
321
-
322
-
323
-
324
-
325
-
326
-
327
-
328
-
329
-
330
-
331
-
332
-
333
-
334
-
335
-
336
-
337
-
338
-
339
-
340
-
341
-
342
-
343
-
344
-
345
-
346
-
347
-
348
-
349
-
350
-
351
-
352
-
353
-
354
-
355
-
356
-
357
-
358
-
359
-
360
-
361
-
362
-
363
-
364
-
365
-
366
-
367
-
368
-
369
-
370
-
371
-
372
-
373
-
374
-
375
-
376
-
377
-
378
-
379
-
380
-
381
-
382
-
383
-
384
-
385
-
386
-
387
-
388
-
389
-
390
-
391
-
392
-
393
-
394
-
395
-
396
-
397
-
398
-
399
-
400
-
401
-
402
-
403
-
404
-
405
-
406
-
407
-
408
-
409
-
410
-
411
-
412
-
413
-
414
-
415
-
416
-
417
-
418
-
419
-
420
-
421
-
422
-
423
-
424
-
425
-
426
-
427
-
428
-
429
-
430
-
431
-
432
-
433
-
434
-
435
-
436
-
437
-
438
-
439
-
440
-
441
-
442
-
443
-
444
-
445
-
446
-
447
-
448
-
449
-
450
-
451
-
452
-
453
-
454
-
455
-
456
-
457
-
458
 |
 |

HSBC HOLDINGS PLC
Report of the Directors: Financial Review (continued)
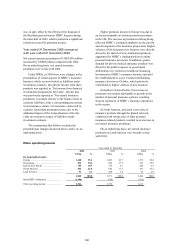
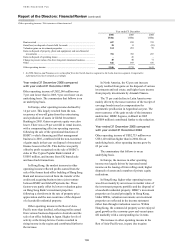
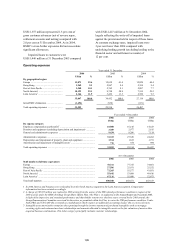
Operating expenses
140
Year ended 31 December 2006 compared
with year ended 31 December 2005
Operating expenses of US$33,553 million were
US$4,039 million, or 14 per cent, higher than in
2005, and 11 per cent higher on an underlying basis.
The commentary that follows is on an
underlying basis.
The main drivers of cost growth were as
follows:
• various business expansion initiatives were
undertaken during the year. The retail banking
operation in the US was enhanced in the form of
new branches and improved geographical
coverage of Commercial Banking. In the UK,
major work was undertaken to refurbish the
branch network, improve and increase the
number of self-service machines and extend
opening hours in certain branches. Across the
Rest of the Asia-Pacific region, the branch
network expanded, the rollout of the consumer
finance business continued, and Commercial
Banking’s operations were further developed. In
Latin America, improvements were made to
HSBC’s operations in Mexico through the
continued expansion of the branch and ATM
network;
• the higher costs incurred in Corporate,
Investment Banking and Markets reflected the
first full year effect of investments made in
2005, together with volume-driven growth in
transactional banking and securities services
activities and performance-related pay, which
rose as revenues grew. The cost efficiency ratio
of Corporate, Investment Banking and Markets
improved by 40 basis points as net operating
income before loan impairment charges grew
faster than costs; and
• HSBC’s expenditure on marketing continued in
order to increase brand awareness, grow market
share in key products and support the launch of
new products. Notable successes included the
online savings product in the US, strong growth
in credit card acquisition across the Group, and
an innovative new online mortgage product
offered in Mexico.
The following points are also of note.
In Europe, the cost growth of 9 per cent was
concentrated in Personal Financial Services and
Corporate, Investment Banking and Markets. In
Personal Financial Services, business expansion
across the region drove the expenditure. In the UK,
costs rose as the branch network refurbishment
programme proceeded, additional staff were
recruited to support longer opening hours in certain
branches and IT costs increased. In France and
Turkey, costs rose from the recruitment of additional
sales staff and higher marketing expenditure. Costs
in Corporate, Investment Banking and Markets
increased, reflecting higher performance-related staff
costs and the full year effect of the investment in
2005 in the business, especially in structured
derivatives and Global Transaction Banking, where
significant revenue growth was seen. These cost
increases were partly offset by a reduction in
Commercial Banking expenses following the sale of
vehicle finance fleet management activities in the
UK.
In Hong Kong, the increase in operating
expenses of 14 per cent was mainly due to higher
staff and marketing costs. Additional staff recruited
to support longer opening hours in the branch
network and the expansion of Commercial
Banking, and an increase in revenue-driven
performance-related awards drove staff costs higher.
Marketing expenditure incurred on advertising and
promotional activities rose in support of credit card
and investment fund products in Personal Financial
Services and the launch of Commercial Banking’s
global campaign. The full year effect of the
enhancement in the second half of 2005 of
Corporate, Investment Banking and Markets’
business contributed further to the cost growth.
The 27 per cent rise in operating expenses in the
Rest of Asia-Pacific region was primarily incurred in
supporting retail business expansion. Staff costs rose
from increased recruitment to support new business
initiatives and incentive payments grew in response
to improved revenues. Marketing expenses rose as
advertising and promotional activity aimed at
enlarging HSBC’s market share in cards, mortgages
and other unsecured lending grew, and Commercial
Banking marketing activity across several countries
increased. In Corporate, Investment Banking and
Markets, cost growth reflected higher revenue-driven
performance-related costs and increased expenditure
in Global Transaction Banking necessitated by
business volumes.
In North America, costs rose by 13 per cent in
2006. In the US, the increase accompanied the
expansion of both the core banking network (by
25 branches) and the geographical presence of
Commercial Banking, and arose from incremental
costs incurred in support of revenue growth in the
consumer finance business. Marketing expenditure
also rose, in line with increased levels of activity in
the cards businesses in the US, continued promotion
of the online savings product and airport branding