HSBC 2006 Annual Report Download - page 136
Download and view the complete annual report
Please find page 136 of the 2006 HSBC annual report below. You can navigate through the pages in the report by either clicking on the pages listed below, or by using the keyword search tool below to find specific information within the annual report.-
 1
1 -
2
-
3
-
4
-
5
-
6
-
7
-
8
-
9
-
10
-
11
-
12
-
13
-
14
-
15
-
16
-
17
-
18
-
19
-
20
-
21
-
22
-
23
-
24
-
25
-
26
-
27
-
28
-
29
-
30
-
31
-
32
-
33
-
34
-
35
-
36
-
37
-
38
-
39
-
40
-
41
-
42
-
43
-
44
-
45
-
46
-
47
-
48
-
49
-
50
-
51
-
52
-
53
-
54
-
55
-
56
-
57
-
58
-
59
-
60
-
61
-
62
-
63
-
64
-
65
-
66
-
67
-
68
-
69
-
70
-
71
-
72
-
73
-
74
-
75
-
76
-
77
-
78
-
79
-
80
-
81
-
82
-
83
-
84
-
85
-
86
-
87
-
88
-
89
-
90
-
91
-
92
-
93
-
94
-
95
-
96
-
97
-
98
-
99
-
100
-
101
-
102
-
103
-
104
-
105
-
106
-
107
-
108
-
109
-
110
-
111
-
112
-
113
-
114
-
115
-
116
-
117
-
118
-
119
-
120
-
121
-
122
-
123
-
124
-
125
-
 126
126 -
 127
127 -
 128
128 -
 129
129 -
 130
130 -
 131
131 -
 132
132 -
 133
133 -
 134
134 -
 135
135 -
 136
136 -
 137
137 -
 138
138 -
 139
139 -
 140
140 -
 141
141 -
 142
142 -
 143
143 -
 144
144 -
 145
145 -
 146
146 -
147
-
148
-
149
-
150
-
151
-
152
-
153
-
154
-
155
-
156
-
157
-
158
-
159
-
160
-
161
-
162
-
163
-
164
-
165
-
166
-
167
-
168
-
169
-
170
-
171
-
172
-
173
-
174
-
175
-
176
-
177
-
178
-
179
-
180
-
181
-
182
-
183
-
184
-
185
-
186
-
187
-
188
-
189
-
190
-
191
-
192
-
193
-
194
-
195
-
196
-
197
-
198
-
199
-
200
-
201
-
202
-
203
-
204
-
205
-
206
-
207
-
208
-
209
-
210
-
211
-
212
-
213
-
214
-
215
-
216
-
217
-
218
-
219
-
220
-
221
-
222
-
223
-
224
-
225
-
226
-
227
-
228
-
229
-
230
-
231
-
232
-
233
-
234
-
235
-
236
-
237
-
238
-
239
-
240
-
241
-
242
-
243
-
244
-
245
-
246
-
247
-
248
-
249
-
250
-
251
-
252
-
253
-
254
-
255
-
256
-
257
-
258
-
259
-
260
-
261
-
262
-
263
-
264
-
265
-
266
-
267
-
268
-
269
-
270
-
271
-
272
-
273
-
274
-
275
-
276
-
277
-
278
-
279
-
280
-
281
-
282
-
283
-
284
-
285
-
286
-
287
-
288
-
289
-
290
-
291
-
292
-
293
-
294
-
295
-
296
-
297
-
298
-
299
-
300
-
301
-
302
-
303
-
304
-
305
-
306
-
307
-
308
-
309
-
310
-
311
-
312
-
313
-
314
-
315
-
316
-
317
-
318
-
319
-
320
-
321
-
322
-
323
-
324
-
325
-
326
-
327
-
328
-
329
-
330
-
331
-
332
-
333
-
334
-
335
-
336
-
337
-
338
-
339
-
340
-
341
-
342
-
343
-
344
-
345
-
346
-
347
-
348
-
349
-
350
-
351
-
352
-
353
-
354
-
355
-
356
-
357
-
358
-
359
-
360
-
361
-
362
-
363
-
364
-
365
-
366
-
367
-
368
-
369
-
370
-
371
-
372
-
373
-
374
-
375
-
376
-
377
-
378
-
379
-
380
-
381
-
382
-
383
-
384
-
385
-
386
-
387
-
388
-
389
-
390
-
391
-
392
-
393
-
394
-
395
-
396
-
397
-
398
-
399
-
400
-
401
-
402
-
403
-
404
-
405
-
406
-
407
-
408
-
409
-
410
-
411
-
412
-
413
-
414
-
415
-
416
-
417
-
418
-
419
-
420
-
421
-
422
-
423
-
424
-
425
-
426
-
427
-
428
-
429
-
430
-
431
-
432
-
433
-
434
-
435
-
436
-
437
-
438
-
439
-
440
-
441
-
442
-
443
-
444
-
445
-
446
-
447
-
448
-
449
-
450
-
451
-
452
-
453
-
454
-
455
-
456
-
457
-
458
 |
 |

HSBC HOLDINGS PLC
Report of the Directors: Financial Review (continued)
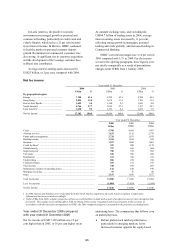
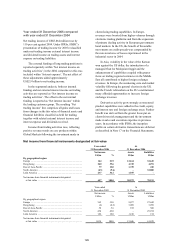
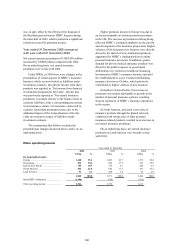
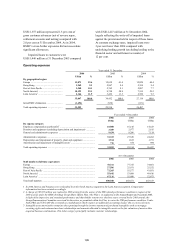
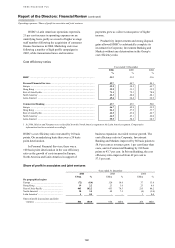
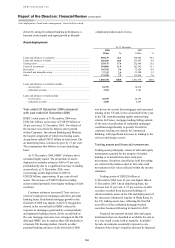
Other operating income / Net insurance claims incurred
134
Year ended 31 December
2006
US$m
2005
US$m
2004
US$m
Rent received ................................................................................................... 687 859 793
Gain/(loss) on disposal of assets held for resale ............................................. 28 11 (93)
Valuation gains on investment properties ....................................................... 164 201 99
Gain on disposal of property, plant and equipment, and non-financial
investments .................................................................................................. 781 703 267
Gain on disposal of operating leases ............................................................... – 26 –
Change in present value of in-force long-term insurance business ................ 40 40 71
Other ................................................................................................................ 846 893 476
Other operating income ................................................................................... 2,546 2,733 1,613
1 In 2006, Mexico and Panama were reclassified from the North America segment to the Latin America segment. Comparative
information has been restated accordingly.
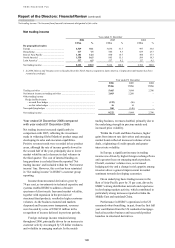
Year ended 31 December 2006 compared
with year ended 31 December 2005
Other operating income of US$2,546 million was
7 per cent lower than in 2005, 9 per cent lower on an
underlying basis. The commentary that follows is on
an underlying basis.
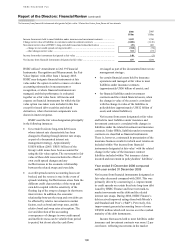
In Europe, other operating income declined by
14 per cent. This largely resulted from the non-
recurrence of one-off gains from the restructuring
and syndication of assets in Global Investment
Banking in 2005. Gains on private equity were also
lower. There was a 29 per cent fall in rental income,
with a compensating effect on operating expenses,
following the sale of the operational functions of
HSBC’s vehicle financing and fleet management
business in 2005, combined with the non-recurrence
of gains made in that year on disposal of structured
finance leases in the UK. This decline was partly
offset by profit recognised on the sale of HSBC’s
stake in The Cyprus Popular Bank Limited of
US$93 million, and income from UK branch sale
and lease-back transactions.
In Hong Kong, the modest increase in other
operating income reflected profits earned from the
sale of the former head office building of Hang Seng
Bank and income received from the transfer of the
credit card acquiring business into a joint venture
between HSBC and Global Payments Inc. These
factors were partly offset by lower revaluation gains
on Hang Seng Bank’s investment properties
following a slowdown in the rate of property price
appreciation and the non-recurrence of the disposal
of a leasehold residential property.
Other operating income in the Rest of Asia-
Pacific more than doubled, reflecting profits earned
from various business disposals in Australia and the
sale of an office building in Japan. Higher levels of
activity at the Group Service Centres resulted in
rising income in the region and contributed further to
the increase.
In North America, the 42 per cent increase
largely resulted from gains on the disposal of various
investments and real estate, and higher lease income
from property investments by Amanah Finance.
The 73 per cent decline in Latin America was
mainly driven by the non-recurrence of the receipt of
coverage bonds issued as compensation for
asymmetric pesification in Argentina last year. The
non-recurrence of the gain on sale of the insurance
underwriter, HSBC Seguros, in Brazil in 2005
(US$89 million) contributed further to the reduction.
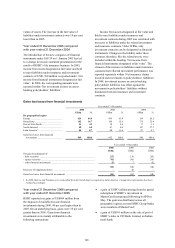
Year ended 31 December 2005 compared
with year ended 31 December 2004
Other operating income of US$2,733 million was
US$1,120 million higher than in 2004. On an
underlying basis, other operating income grew by
69 per cent.
The commentary that follows is on an
underlying basis.
In Europe, the increase in other operating
income was largely driven by increased rental
income on the leasing of train rolling stock, higher
disposals of assets and a number of private equity
realisations.
In Hong Kong, higher other operating income
was driven mainly by an increase in market value of
the investment property portfolio and the disposal of
a leasehold residential property. HSBC’s investment
properties are located principally in Hong Kong.
Under IFRSs, valuation movements on investment
properties are reflected in the income statement
rather than through revaluation reserves. Within
Hong Kong, the commercial property sector enjoyed
good growth as the economy grew and vacant space
fell markedly with a corresponding rise in rents.
The increase in other operating income in the
Rest of Asia-Pacific was, in part, due to gains