HSBC 2006 Annual Report Download - page 86
Download and view the complete annual report
Please find page 86 of the 2006 HSBC annual report below. You can navigate through the pages in the report by either clicking on the pages listed below, or by using the keyword search tool below to find specific information within the annual report.-
 1
1 -
2
-
3
-
4
-
5
-
6
-
7
-
8
-
9
-
10
-
11
-
12
-
13
-
14
-
15
-
16
-
17
-
18
-
19
-
20
-
21
-
22
-
23
-
24
-
25
-
26
-
27
-
28
-
29
-
30
-
31
-
32
-
33
-
34
-
35
-
36
-
37
-
38
-
39
-
40
-
41
-
42
-
43
-
44
-
45
-
46
-
47
-
48
-
49
-
50
-
51
-
52
-
53
-
54
-
55
-
56
-
57
-
58
-
59
-
60
-
61
-
62
-
63
-
64
-
65
-
66
-
67
-
68
-
69
-
70
-
71
-
72
-
73
-
74
-
75
-
 76
76 -
 77
77 -
 78
78 -
 79
79 -
 80
80 -
 81
81 -
 82
82 -
 83
83 -
 84
84 -
 85
85 -
 86
86 -
 87
87 -
 88
88 -
 89
89 -
 90
90 -
 91
91 -
 92
92 -
 93
93 -
 94
94 -
 95
95 -
 96
96 -
97
-
98
-
99
-
100
-
101
-
102
-
103
-
104
-
105
-
106
-
107
-
108
-
109
-
110
-
111
-
112
-
113
-
114
-
115
-
116
-
117
-
118
-
119
-
120
-
121
-
122
-
123
-
124
-
125
-
126
-
127
-
128
-
129
-
130
-
131
-
132
-
133
-
134
-
135
-
136
-
137
-
138
-
139
-
140
-
141
-
142
-
143
-
144
-
145
-
146
-
147
-
148
-
149
-
150
-
151
-
152
-
153
-
154
-
155
-
156
-
157
-
158
-
159
-
160
-
161
-
162
-
163
-
164
-
165
-
166
-
167
-
168
-
169
-
170
-
171
-
172
-
173
-
174
-
175
-
176
-
177
-
178
-
179
-
180
-
181
-
182
-
183
-
184
-
185
-
186
-
187
-
188
-
189
-
190
-
191
-
192
-
193
-
194
-
195
-
196
-
197
-
198
-
199
-
200
-
201
-
202
-
203
-
204
-
205
-
206
-
207
-
208
-
209
-
210
-
211
-
212
-
213
-
214
-
215
-
216
-
217
-
218
-
219
-
220
-
221
-
222
-
223
-
224
-
225
-
226
-
227
-
228
-
229
-
230
-
231
-
232
-
233
-
234
-
235
-
236
-
237
-
238
-
239
-
240
-
241
-
242
-
243
-
244
-
245
-
246
-
247
-
248
-
249
-
250
-
251
-
252
-
253
-
254
-
255
-
256
-
257
-
258
-
259
-
260
-
261
-
262
-
263
-
264
-
265
-
266
-
267
-
268
-
269
-
270
-
271
-
272
-
273
-
274
-
275
-
276
-
277
-
278
-
279
-
280
-
281
-
282
-
283
-
284
-
285
-
286
-
287
-
288
-
289
-
290
-
291
-
292
-
293
-
294
-
295
-
296
-
297
-
298
-
299
-
300
-
301
-
302
-
303
-
304
-
305
-
306
-
307
-
308
-
309
-
310
-
311
-
312
-
313
-
314
-
315
-
316
-
317
-
318
-
319
-
320
-
321
-
322
-
323
-
324
-
325
-
326
-
327
-
328
-
329
-
330
-
331
-
332
-
333
-
334
-
335
-
336
-
337
-
338
-
339
-
340
-
341
-
342
-
343
-
344
-
345
-
346
-
347
-
348
-
349
-
350
-
351
-
352
-
353
-
354
-
355
-
356
-
357
-
358
-
359
-
360
-
361
-
362
-
363
-
364
-
365
-
366
-
367
-
368
-
369
-
370
-
371
-
372
-
373
-
374
-
375
-
376
-
377
-
378
-
379
-
380
-
381
-
382
-
383
-
384
-
385
-
386
-
387
-
388
-
389
-
390
-
391
-
392
-
393
-
394
-
395
-
396
-
397
-
398
-
399
-
400
-
401
-
402
-
403
-
404
-
405
-
406
-
407
-
408
-
409
-
410
-
411
-
412
-
413
-
414
-
415
-
416
-
417
-
418
-
419
-
420
-
421
-
422
-
423
-
424
-
425
-
426
-
427
-
428
-
429
-
430
-
431
-
432
-
433
-
434
-
435
-
436
-
437
-
438
-
439
-
440
-
441
-
442
-
443
-
444
-
445
-
446
-
447
-
448
-
449
-
450
-
451
-
452
-
453
-
454
-
455
-
456
-
457
-
458
 |
 |

HSBC HOLDINGS PLC
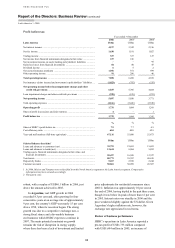
Report of the Directors: Business Review (continued)
North America > 2005
84
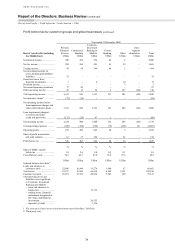
businesses. These volume benefits were largely
offset by narrowing spreads as yields fell due to
changes in product mix and higher funding costs.
Prime mortgages originated in 2005 were
largely sold into the large government-sponsored
mortgage associations, reflecting a strategic decision
to focus on loans originated through the retail
channel and reduce HSBC’s reliance on lower
spread business generated by the network of
mortgage correspondents. The improvements in
retail channel sales were achieved by capitalising on
the HSBC brand, and the newly expanded branch
network and customer base. As interest rates rose,
demand for ARM products in 2005 declined as
customers migrated towards longer-term fixed rate
mortgages. ARM-originated loans fell from 67 per
cent of all loans originated in 2004 to 30 per cent in
2005. Spreads narrowed on prime mortgages, largely
because of higher funding costs and marginally
lower yields, the latter due to the full year effect of
the strong growth of lower-yielding ARMs
originated in 2004.
HSBC continued to grow its sub-prime and
near-prime mortgage portfolios, primarily within the
mortgage services and branch-based consumer
lending businesses. The mortgage services business,
which purchases mortgage loans from a network of
correspondents, recorded strong average loan growth
of 42 per cent to US$39.1 billion, of which
US$1.7 billion related to mortgages held for resale.
Continued focus on growing the second lien
portfolio, widening the first lien product offering and
expanding sources for the purchase of loans from
‘flow’ correspondents contributed further to the
increase. Within the branch-based consumer lending
business, average mortgage balances grew by 19 per
cent to US$35.7 billion, reflecting a combination of
increased marketing activity and higher sales
volumes of near-prime mortgages and ARMs, first
introduced in the second half of 2004. In addition,
the consumer lending business purchased
US$1.7 billion of largely sub-prime mortgage loans
through a portfolio acquisition programme. The
benefits of higher sub-prime and near-prime
balances were largely offset by lower spreads. Yields
fell due to the combined effects of strong refinancing
activity, significant amounts of older higher-yielding
loans seasoning, continued product expansion into
the near-prime customer segments and competitive
pricing pressures. The higher cost of funds due to
rising interest rates also contributed to the decline in
spreads.
Average loan balances within the consumer
finance credit cards business rose by 7 per cent to
US$19.8 billion, despite the highly competitive
environment, where overall market growth remained
weak. By increasing the level of marketing
promotions, HSBC was able to grow organically the
HSBC branded prime, Union Privilege and non-
prime portfolios. The benefit of higher balances was
more than offset by higher funding costs. Yields,
however, improved due to a combination of higher-
yielding sub-prime receivable balances, increased
pricing on variable rate products and other re-pricing
initiatives.
In the retail services cards business, average
loan balances grew by 7 per cent to US$15.9 billion.
This growth was driven by new loan originations and
the agreement of new merchant relationships with
The Neiman Marcus Group Inc, Bon Ton Stores Inc
and OfficeMax, which contributed US$506 million
of the overall increase. The benefit of higher loan
balances was more than offset by lower spreads.
Spreads declined as a large proportion of the loan
book, priced at fixed rates, was affected by higher
funding costs as interest rates rose. Spreads also
narrowed as changes in the product mix reflected
strong growth of lower-yielding recreational vehicle
balances and external pricing pressures. Changes in
contractual obligations associated with a merchant
also had an adverse effect, but this resulted in lower
merchant fees payable.
The vehicle finance business reported strong
organic growth, with a 14 per cent increase in
average loan balances, largely due to increases in the
near-prime portfolio. This growth in balances was
mainly driven by a combination of higher new loan
originations acquired from the dealer network, in
part due to the success of the ‘employee pricing’
incentive programmes introduced by a number of the
large car manufacturers, and strong growth in the
consumer direct loan programme. A new strategic
alliance helped grow loans further, generating
US$234 million of new balances. These volume
benefits were largely offset by lower spreads, due to
higher funding costs and lower yields. Yields fell
due to product expansion into the near-prime
portfolio, coupled with competitive pricing pressures
due to excess market capacity.
Personal non-credit card average loan balances
in the consumer finance business grew by 8 per cent
to US$16.0 billion, reflecting the success of several
large direct mail campaigns and increased
availability of this product in the US market.
Improvements in underwriting processes, aided by
continued improvements in the US economy, also
contributed to the increase. These benefits were
partly offset by lower spreads, due to higher funding
costs.