HSBC 2006 Annual Report Download - page 15
Download and view the complete annual report
Please find page 15 of the 2006 HSBC annual report below. You can navigate through the pages in the report by either clicking on the pages listed below, or by using the keyword search tool below to find specific information within the annual report.-
 1
1 -
2
-
3
-
4
-
 5
5 -
 6
6 -
 7
7 -
 8
8 -
 9
9 -
 10
10 -
 11
11 -
 12
12 -
 13
13 -
 14
14 -
 15
15 -
 16
16 -
 17
17 -
 18
18 -
 19
19 -
 20
20 -
 21
21 -
 22
22 -
 23
23 -
 24
24 -
 25
25 -
26
-
27
-
28
-
29
-
30
-
31
-
32
-
33
-
34
-
35
-
36
-
37
-
38
-
39
-
40
-
41
-
42
-
43
-
44
-
45
-
46
-
47
-
48
-
49
-
50
-
51
-
52
-
53
-
54
-
55
-
56
-
57
-
58
-
59
-
60
-
61
-
62
-
63
-
64
-
65
-
66
-
67
-
68
-
69
-
70
-
71
-
72
-
73
-
74
-
75
-
76
-
77
-
78
-
79
-
80
-
81
-
82
-
83
-
84
-
85
-
86
-
87
-
88
-
89
-
90
-
91
-
92
-
93
-
94
-
95
-
96
-
97
-
98
-
99
-
100
-
101
-
102
-
103
-
104
-
105
-
106
-
107
-
108
-
109
-
110
-
111
-
112
-
113
-
114
-
115
-
116
-
117
-
118
-
119
-
120
-
121
-
122
-
123
-
124
-
125
-
126
-
127
-
128
-
129
-
130
-
131
-
132
-
133
-
134
-
135
-
136
-
137
-
138
-
139
-
140
-
141
-
142
-
143
-
144
-
145
-
146
-
147
-
148
-
149
-
150
-
151
-
152
-
153
-
154
-
155
-
156
-
157
-
158
-
159
-
160
-
161
-
162
-
163
-
164
-
165
-
166
-
167
-
168
-
169
-
170
-
171
-
172
-
173
-
174
-
175
-
176
-
177
-
178
-
179
-
180
-
181
-
182
-
183
-
184
-
185
-
186
-
187
-
188
-
189
-
190
-
191
-
192
-
193
-
194
-
195
-
196
-
197
-
198
-
199
-
200
-
201
-
202
-
203
-
204
-
205
-
206
-
207
-
208
-
209
-
210
-
211
-
212
-
213
-
214
-
215
-
216
-
217
-
218
-
219
-
220
-
221
-
222
-
223
-
224
-
225
-
226
-
227
-
228
-
229
-
230
-
231
-
232
-
233
-
234
-
235
-
236
-
237
-
238
-
239
-
240
-
241
-
242
-
243
-
244
-
245
-
246
-
247
-
248
-
249
-
250
-
251
-
252
-
253
-
254
-
255
-
256
-
257
-
258
-
259
-
260
-
261
-
262
-
263
-
264
-
265
-
266
-
267
-
268
-
269
-
270
-
271
-
272
-
273
-
274
-
275
-
276
-
277
-
278
-
279
-
280
-
281
-
282
-
283
-
284
-
285
-
286
-
287
-
288
-
289
-
290
-
291
-
292
-
293
-
294
-
295
-
296
-
297
-
298
-
299
-
300
-
301
-
302
-
303
-
304
-
305
-
306
-
307
-
308
-
309
-
310
-
311
-
312
-
313
-
314
-
315
-
316
-
317
-
318
-
319
-
320
-
321
-
322
-
323
-
324
-
325
-
326
-
327
-
328
-
329
-
330
-
331
-
332
-
333
-
334
-
335
-
336
-
337
-
338
-
339
-
340
-
341
-
342
-
343
-
344
-
345
-
346
-
347
-
348
-
349
-
350
-
351
-
352
-
353
-
354
-
355
-
356
-
357
-
358
-
359
-
360
-
361
-
362
-
363
-
364
-
365
-
366
-
367
-
368
-
369
-
370
-
371
-
372
-
373
-
374
-
375
-
376
-
377
-
378
-
379
-
380
-
381
-
382
-
383
-
384
-
385
-
386
-
387
-
388
-
389
-
390
-
391
-
392
-
393
-
394
-
395
-
396
-
397
-
398
-
399
-
400
-
401
-
402
-
403
-
404
-
405
-
406
-
407
-
408
-
409
-
410
-
411
-
412
-
413
-
414
-
415
-
416
-
417
-
418
-
419
-
420
-
421
-
422
-
423
-
424
-
425
-
426
-
427
-
428
-
429
-
430
-
431
-
432
-
433
-
434
-
435
-
436
-
437
-
438
-
439
-
440
-
441
-
442
-
443
-
444
-
445
-
446
-
447
-
448
-
449
-
450
-
451
-
452
-
453
-
454
-
455
-
456
-
457
-
458
 |
 |

13
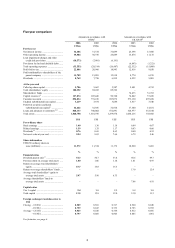
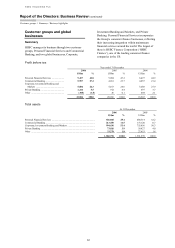
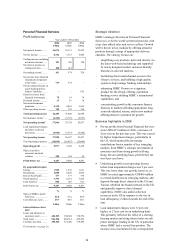
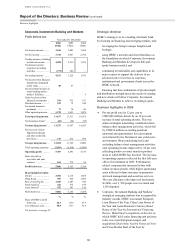
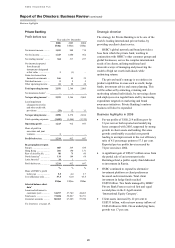
Personal Financial Services
Profit before tax
Year ended 31 December
2006 2005 2004
US$m US$m US$m
Net interest income ......... 26,076 23,351 21,422
Net fee income ................ 8,762 7,313 6,406
Trading income excluding
net interest income ....... 391 360 320
Net interest income on
trading activities ........... 220 214 –
Net trading income1 ........ 611 574 320
Net income from financial
instruments designated
at fair value .................. 739 574 –
Net investment income on
assets backing policy-
holders’ liabilities ......... – – 635
Gains less losses from
financial investments ... 78 19 79
Dividend income ............. 31 16 16
Net earned insurance
premiums ..................... 5,130 4,864 3,652
Other operating income .. 782 729 360
Total operating income 42,209 37,440 32,890
Net insurance claims2 ..... (4,365) (3,716) (2,953)
Net operating income3... 37,844 33,724 29,937
Loan impairment charges
and other credit risk
provisions ..................... (9,949) (7,537) (6,500)
Net operating income ... 27,895 26,187 23,437
Total operating expenses (18,818) (16,427) (15,009)
Operating profit ............ 9,077 9,760 8,428
Share of profit in
associates and joint
ventures ........................ 380 144 69
Profit before tax ............ 9,457 9,904 8,497
By geographical region
Europe ............................. 1,909 1,932 1,621
Hong Kong ..................... 2,880 2,628 2,063
Rest of Asia-Pacific ........ 477 377 336
North America4 ............... 3,391 4,181 3,826
Latin America4 ................ 800 786 651
Profit before tax .............. 9,457 9,904 8,497
% % %
Share of HSBC’s profit
before tax .....................
42.8
47.2 44.9
Cost efficiency ratio ........ 49.7 48.7 50.1
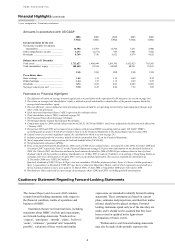
US$m US$m US$m
Selected balance sheet
data5
Loans and advances to
customers (net) ............. 448,545 398,884 370,576
Total assets ...................... 546,568 484,314 452,992
Customer accounts .......... 388,468 321,240 319,485
For footnotes, see page 26.
Strategic direction
HSBC’s strategic direction in Personal Financial
Services is to be the world’s preferred provider, with
a top class ethical sales and service culture. Growth
will be driven in key markets by offering attractive
products through a range of appropriate delivery
channels. The strategy focuses on:
- simplifying core products, delivered directly via
the latest web-based technology and supported
by newly designed modern customer-friendly
branches in selected markets;
- facilitating direct multi-channel access to the
Group’s services, and building a high quality
system to help manage banking relationships;
- enhancing HSBC Premier as a signature
product for the Group, offering a premium
banking service utilising HSBC’s international
capabilities; and
- concentrating growth in the consumer finance
business in markets affording appropriate long-
term risk-adjusted returns, and in new markets
offering attractive potential for growth.
Business highlights in 2006
• Pre-tax profits from Personal Financial Services
were US$9,457 million in 2006, a decrease of
5 per cent on the previous year. This was caused
by higher impairment charges, particularly in
the US, which masked the increasing
contributions from a number of key emerging
markets, from HSBC’s strategic investments in
associates and from strong growth in Hong
Kong. On an underlying basis, profit before tax
was 8 per cent lower.
• Underlying growth in net operating income
before loan impairment charges was 9 per cent.
This was lower than cost growth, however, as
HSBC invested approximately US$400 million
to extend distribution in emerging markets, add
deposits through direct channels in the US and
Taiwan, refurbish the branch network in the UK
and generally improve direct channel
capabilities. HSBC also added collection
resources in the US in response to the rise in
loan delinquency evident towards the end of the
year.
• Loan impairment charges were 32 per cent
higher, or 27 per cent on an underlying basis.
This primarily reflected the effect of a slowing
housing market and rising interest rates on sub-
prime mortgage lending in the US, in particular
where HSBC had a second lien position. The
increase was concentrated in the correspondent