HSBC 2006 Annual Report Download - page 238
Download and view the complete annual report
Please find page 238 of the 2006 HSBC annual report below. You can navigate through the pages in the report by either clicking on the pages listed below, or by using the keyword search tool below to find specific information within the annual report.-
 1
1 -
2
-
3
-
4
-
5
-
6
-
7
-
8
-
9
-
10
-
11
-
12
-
13
-
14
-
15
-
16
-
17
-
18
-
19
-
20
-
21
-
22
-
23
-
24
-
25
-
26
-
27
-
28
-
29
-
30
-
31
-
32
-
33
-
34
-
35
-
36
-
37
-
38
-
39
-
40
-
41
-
42
-
43
-
44
-
45
-
46
-
47
-
48
-
49
-
50
-
51
-
52
-
53
-
54
-
55
-
56
-
57
-
58
-
59
-
60
-
61
-
62
-
63
-
64
-
65
-
66
-
67
-
68
-
69
-
70
-
71
-
72
-
73
-
74
-
75
-
76
-
77
-
78
-
79
-
80
-
81
-
82
-
83
-
84
-
85
-
86
-
87
-
88
-
89
-
90
-
91
-
92
-
93
-
94
-
95
-
96
-
97
-
98
-
99
-
100
-
101
-
102
-
103
-
104
-
105
-
106
-
107
-
108
-
109
-
110
-
111
-
112
-
113
-
114
-
115
-
116
-
117
-
118
-
119
-
120
-
121
-
122
-
123
-
124
-
125
-
126
-
127
-
128
-
129
-
130
-
131
-
132
-
133
-
134
-
135
-
136
-
137
-
138
-
139
-
140
-
141
-
142
-
143
-
144
-
145
-
146
-
147
-
148
-
149
-
150
-
151
-
152
-
153
-
154
-
155
-
156
-
157
-
158
-
159
-
160
-
161
-
162
-
163
-
164
-
165
-
166
-
167
-
168
-
169
-
170
-
171
-
172
-
173
-
174
-
175
-
176
-
177
-
178
-
179
-
180
-
181
-
182
-
183
-
184
-
185
-
186
-
187
-
188
-
189
-
190
-
191
-
192
-
193
-
194
-
195
-
196
-
197
-
198
-
199
-
200
-
201
-
202
-
203
-
204
-
205
-
206
-
207
-
208
-
209
-
210
-
211
-
212
-
213
-
214
-
215
-
216
-
217
-
218
-
219
-
220
-
221
-
222
-
223
-
224
-
225
-
226
-
227
-
 228
228 -
 229
229 -
 230
230 -
 231
231 -
 232
232 -
 233
233 -
 234
234 -
 235
235 -
 236
236 -
 237
237 -
 238
238 -
 239
239 -
 240
240 -
 241
241 -
 242
242 -
 243
243 -
 244
244 -
 245
245 -
 246
246 -
 247
247 -
 248
248 -
249
-
250
-
251
-
252
-
253
-
254
-
255
-
256
-
257
-
258
-
259
-
260
-
261
-
262
-
263
-
264
-
265
-
266
-
267
-
268
-
269
-
270
-
271
-
272
-
273
-
274
-
275
-
276
-
277
-
278
-
279
-
280
-
281
-
282
-
283
-
284
-
285
-
286
-
287
-
288
-
289
-
290
-
291
-
292
-
293
-
294
-
295
-
296
-
297
-
298
-
299
-
300
-
301
-
302
-
303
-
304
-
305
-
306
-
307
-
308
-
309
-
310
-
311
-
312
-
313
-
314
-
315
-
316
-
317
-
318
-
319
-
320
-
321
-
322
-
323
-
324
-
325
-
326
-
327
-
328
-
329
-
330
-
331
-
332
-
333
-
334
-
335
-
336
-
337
-
338
-
339
-
340
-
341
-
342
-
343
-
344
-
345
-
346
-
347
-
348
-
349
-
350
-
351
-
352
-
353
-
354
-
355
-
356
-
357
-
358
-
359
-
360
-
361
-
362
-
363
-
364
-
365
-
366
-
367
-
368
-
369
-
370
-
371
-
372
-
373
-
374
-
375
-
376
-
377
-
378
-
379
-
380
-
381
-
382
-
383
-
384
-
385
-
386
-
387
-
388
-
389
-
390
-
391
-
392
-
393
-
394
-
395
-
396
-
397
-
398
-
399
-
400
-
401
-
402
-
403
-
404
-
405
-
406
-
407
-
408
-
409
-
410
-
411
-
412
-
413
-
414
-
415
-
416
-
417
-
418
-
419
-
420
-
421
-
422
-
423
-
424
-
425
-
426
-
427
-
428
-
429
-
430
-
431
-
432
-
433
-
434
-
435
-
436
-
437
-
438
-
439
-
440
-
441
-
442
-
443
-
444
-
445
-
446
-
447
-
448
-
449
-
450
-
451
-
452
-
453
-
454
-
455
-
456
-
457
-
458
 |
 |

HSBC HOLDINGS PLC
Report of the Directors: The Management of Risk (continued)
Insurance operations > Market risk / Credit risk
236
• annual return: the annual return is guaranteed to
be no lower that a specified rate. This can be the
investment return credited to the policyholder
every year (referred to as a ‘hard’ guarantee), or
the average annual investment return credited to
the policyholder over the life of the policy,
which can be either the maturity date or the
surrender date of the contract (referred to as a
‘soft’ guarantee);
• capital: policyholders are guaranteed to receive
no less than the premiums paid less expenses, or
a cash payment or series of cash payments
whose amounts are at least equal to those
defined within the policy; and
• market performance: policyholders receive an
investment return which is guaranteed to be
within a prescribed range of average investment
returns earned by predetermined market
participants on the specified product.
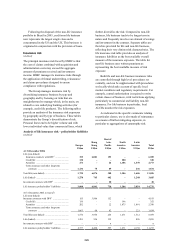
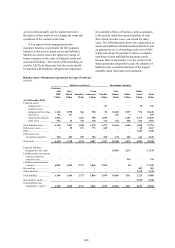
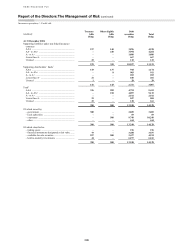
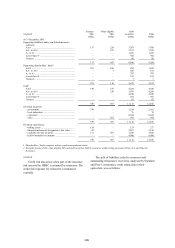
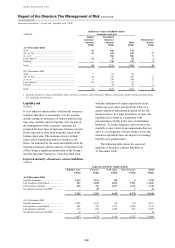
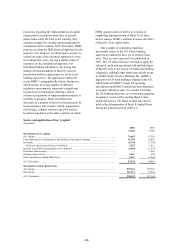
The table below shows, in respect of each
category of guarantee, the total policyholders’
liabilities established for guaranteed products, the
range of investment returns implied by the
guarantees, and the range of current yields of the
investment portfolios supporting the guarantees.
Policyholders’ liabilities
(Audited)
2006 2005
Policy-
holders’
liabilities
Investment
returns
implied by
guarantee1
Current
yields
Policy-
holders’
liabilities
Investment
returns
implied by
guarantee1
Current
yields
US$m % % US$m % %
Annuities in payment .......................................... 1,240 0.0 – 7.0 5.2 – 18.6 1,063 0.0 – 4.2 4.0 – 13.0
Deferred annuities .............................................. 420 0.0 – 6.0 3.9 – 8.6 408 0.0 – 6.0 6.1 – 8.6
Deferred annuities .............................................. 640 6.0 – 9.0 5.7 674 6.0 – 9.0 5.7
Annual return ...................................................... 6,379 0.0 – 3.0 3.3 – 4.5 4,362 0.0 – 3.0 3.5 – 5.6
Annual return ...................................................... 508 3.0 – 6.0 3.8 – 7.9 581 3.0 – 6.0 3.5 – 11.5
Capital ................................................................. 1,196 0.0 2.9 – 4.1 1,168 0.0 2.9 – 5.6
Market performance2 .......................................... 3,723 n/a n/a 2,938 n/a n/a
1 Excluding guarantees from associate insurance companies Erisa, S.A. and Ping An Insurance.
2 There is no specific investment return implied by market performance guarantees because the guarantees are expressed as lying within
prescribed ranges of average market returns.
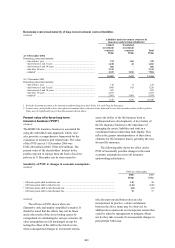
HSBC manages the annual return and capital
guarantees of annuities by seeking to match their risk
exposure with bonds which produce a return at least
equal to the investment return implied by the
guarantee. Provision is made for anticipated
shortfalls, generally calculated by recourse to stress
testing of the likely outcomes.
The main risk arising from these guarantees is
reinvestment risk, which arises primarily when the
duration of the policy extends beyond the maturity
dates of the available bonds. Future reinvestment
yields may be less than the investment rates implied
by the guarantee.
A certain number of these products have been
discontinued, including the deferred annuity
portfolio in HSBC Finance where, as highlighted in
the above table, the current portfolio yield is less
than the guarantee. For this block of business, a
purchase accounting reserve was made when HSBC
Finance was acquired to mitigate the impact of the
disparity in yields. In addition, in the UK there is an
annuity portfolio where the risk is fully reinsured.
For market performance guarantee business in
the table above, HSBC seeks to match the
composition of the investment portfolio with the
composition of the average investment portfolio of
the other market participants. These are published by
the regulator monthly. Liabilities have also been
established to cover any potential shortfall.
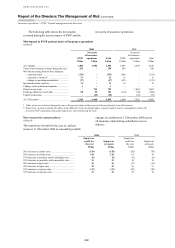
Equity risk
(Audited)
HSBC manages the equity risk arising from its
holdings of equity securities centrally by setting
limits on the maximum market value of equities that
each insurance underwriting subsidiary may hold.
Equity risk is also monitored by estimating the effect
of predetermined movements in equity prices on the
profit and total net assets of the insurance
underwriting subsidiaries.
The following table illustrates the impact on the
aggregated profit for the year and net assets of a
reasonably possible 10 per cent variance in equity
prices: