HSBC 2006 Annual Report Download - page 321
Download and view the complete annual report
Please find page 321 of the 2006 HSBC annual report below. You can navigate through the pages in the report by either clicking on the pages listed below, or by using the keyword search tool below to find specific information within the annual report.-
 1
1 -
2
-
3
-
4
-
5
-
6
-
7
-
8
-
9
-
10
-
11
-
12
-
13
-
14
-
15
-
16
-
17
-
18
-
19
-
20
-
21
-
22
-
23
-
24
-
25
-
26
-
27
-
28
-
29
-
30
-
31
-
32
-
33
-
34
-
35
-
36
-
37
-
38
-
39
-
40
-
41
-
42
-
43
-
44
-
45
-
46
-
47
-
48
-
49
-
50
-
51
-
52
-
53
-
54
-
55
-
56
-
57
-
58
-
59
-
60
-
61
-
62
-
63
-
64
-
65
-
66
-
67
-
68
-
69
-
70
-
71
-
72
-
73
-
74
-
75
-
76
-
77
-
78
-
79
-
80
-
81
-
82
-
83
-
84
-
85
-
86
-
87
-
88
-
89
-
90
-
91
-
92
-
93
-
94
-
95
-
96
-
97
-
98
-
99
-
100
-
101
-
102
-
103
-
104
-
105
-
106
-
107
-
108
-
109
-
110
-
111
-
112
-
113
-
114
-
115
-
116
-
117
-
118
-
119
-
120
-
121
-
122
-
123
-
124
-
125
-
126
-
127
-
128
-
129
-
130
-
131
-
132
-
133
-
134
-
135
-
136
-
137
-
138
-
139
-
140
-
141
-
142
-
143
-
144
-
145
-
146
-
147
-
148
-
149
-
150
-
151
-
152
-
153
-
154
-
155
-
156
-
157
-
158
-
159
-
160
-
161
-
162
-
163
-
164
-
165
-
166
-
167
-
168
-
169
-
170
-
171
-
172
-
173
-
174
-
175
-
176
-
177
-
178
-
179
-
180
-
181
-
182
-
183
-
184
-
185
-
186
-
187
-
188
-
189
-
190
-
191
-
192
-
193
-
194
-
195
-
196
-
197
-
198
-
199
-
200
-
201
-
202
-
203
-
204
-
205
-
206
-
207
-
208
-
209
-
210
-
211
-
212
-
213
-
214
-
215
-
216
-
217
-
218
-
219
-
220
-
221
-
222
-
223
-
224
-
225
-
226
-
227
-
228
-
229
-
230
-
231
-
232
-
233
-
234
-
235
-
236
-
237
-
238
-
239
-
240
-
241
-
242
-
243
-
244
-
245
-
246
-
247
-
248
-
249
-
250
-
251
-
252
-
253
-
254
-
255
-
256
-
257
-
258
-
259
-
260
-
261
-
262
-
263
-
264
-
265
-
266
-
267
-
268
-
269
-
270
-
271
-
272
-
273
-
274
-
275
-
276
-
277
-
278
-
279
-
280
-
281
-
282
-
283
-
284
-
285
-
286
-
287
-
288
-
289
-
290
-
291
-
292
-
293
-
294
-
295
-
296
-
297
-
298
-
299
-
300
-
301
-
302
-
303
-
304
-
305
-
306
-
307
-
308
-
309
-
310
-
 311
311 -
 312
312 -
 313
313 -
 314
314 -
 315
315 -
 316
316 -
 317
317 -
 318
318 -
 319
319 -
 320
320 -
 321
321 -
 322
322 -
 323
323 -
 324
324 -
 325
325 -
 326
326 -
 327
327 -
 328
328 -
 329
329 -
 330
330 -
 331
331 -
332
-
333
-
334
-
335
-
336
-
337
-
338
-
339
-
340
-
341
-
342
-
343
-
344
-
345
-
346
-
347
-
348
-
349
-
350
-
351
-
352
-
353
-
354
-
355
-
356
-
357
-
358
-
359
-
360
-
361
-
362
-
363
-
364
-
365
-
366
-
367
-
368
-
369
-
370
-
371
-
372
-
373
-
374
-
375
-
376
-
377
-
378
-
379
-
380
-
381
-
382
-
383
-
384
-
385
-
386
-
387
-
388
-
389
-
390
-
391
-
392
-
393
-
394
-
395
-
396
-
397
-
398
-
399
-
400
-
401
-
402
-
403
-
404
-
405
-
406
-
407
-
408
-
409
-
410
-
411
-
412
-
413
-
414
-
415
-
416
-
417
-
418
-
419
-
420
-
421
-
422
-
423
-
424
-
425
-
426
-
427
-
428
-
429
-
430
-
431
-
432
-
433
-
434
-
435
-
436
-
437
-
438
-
439
-
440
-
441
-
442
-
443
-
444
-
445
-
446
-
447
-
448
-
449
-
450
-
451
-
452
-
453
-
454
-
455
-
456
-
457
-
458
 |
 |

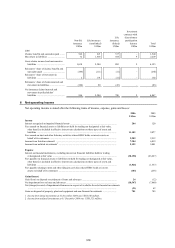
319
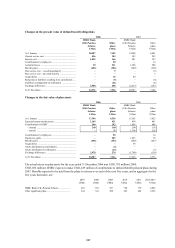
Non-life
insurance
Life insurance
(non-linked)
Life
insurance
(linked)
Investment
contracts with
discretionary
participation
features Total
US$m US$m US$m US$m US$m
2005
Claims, benefits and surrenders paid ........ 966 621 357 – 1,944
Movement in liabilities ............................. 72 1,683 445 9 2,209
Gross claims incurred and movement in
liabilities ............................................... 1,038 2,304 802 9 4,153
Reinsurers’ share of claims, benefits and
surrenders paid ..................................... (146) (111) (11) – (268)
Reinsurers’ share of movement in
liabilities ............................................... 2 191 (11) – 182
Reinsurers’ share of claims incurred and
movement in liabilities .......................... (144) 80 (22) – (86)
Net insurance claims incurred and
movement in policyholders’
liabilities ............................................... 894 2,384 780 9 4,067
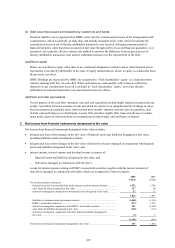
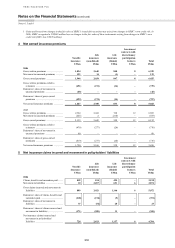
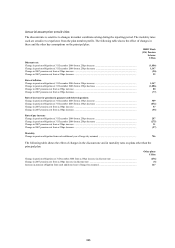
6 Net operating income
Net operating income is stated after the following items of income, expense, gains and losses:
2006 2005
US$m US$m
Income
Interest recognised on impaired financial assets ............................................................................... 284 120
Fees earned on financial assets or liabilities not held for trading nor designated at fair value,
other than fees included in effective interest rate calculations on these types of assets and
liabilities ........................................................................................................................................ 11,182 9,077
Fees earned on trust and other fiduciary activities where HSBC holds or invests assets on
behalf of its customers ................................................................................................................... 2,909 2,912
Income from listed investments1 ....................................................................................................... 7,304 6,819
Income from unlisted investments2 ................................................................................................... 9,192 5,001
Expense
Interest on financial instruments, excluding interest on financial liabilities held for trading
or designated at fair value ............................................................................................................. (38,158) (26,627)
Fees payable on financial assets or liabilities not held for trading nor designated at fair value,
other than fees included in effective interest rate calculations on these types of assets and
liabilities ........................................................................................................................................ (1,826) (1,357)
Fees payable relating to trust and other fiduciary activities where HSBC holds or invests
assets on behalf of its customers ................................................................................................... (103) (238)
Gains/(losses)
Gain /(loss) on disposal or settlement of loans and advances ........................................................... 24 (12)
Net impairment loss on loans and advances ...................................................................................... (10,547) (7,860)
Net (charge)/reversal of impairment allowances in respect of available-for-sale financial investments
........................................................................................................................................................ (21) 42
Gains on disposal of property, plant and equipment and non-financial investments ....................... 781 703
1 Income from listed investments at 31 December 2004 was US$5,166 million.
2 Income from unlisted investments at 31 December 2004 was US$3,521 million.