HSBC 2006 Annual Report Download - page 41
Download and view the complete annual report
Please find page 41 of the 2006 HSBC annual report below. You can navigate through the pages in the report by either clicking on the pages listed below, or by using the keyword search tool below to find specific information within the annual report.-
 1
1 -
2
-
3
-
4
-
5
-
6
-
7
-
8
-
9
-
10
-
11
-
12
-
13
-
14
-
15
-
16
-
17
-
18
-
19
-
20
-
21
-
22
-
23
-
24
-
25
-
26
-
27
-
28
-
29
-
30
-
 31
31 -
 32
32 -
 33
33 -
 34
34 -
 35
35 -
 36
36 -
 37
37 -
 38
38 -
 39
39 -
 40
40 -
 41
41 -
 42
42 -
 43
43 -
 44
44 -
 45
45 -
 46
46 -
 47
47 -
 48
48 -
 49
49 -
 50
50 -
 51
51 -
52
-
53
-
54
-
55
-
56
-
57
-
58
-
59
-
60
-
61
-
62
-
63
-
64
-
65
-
66
-
67
-
68
-
69
-
70
-
71
-
72
-
73
-
74
-
75
-
76
-
77
-
78
-
79
-
80
-
81
-
82
-
83
-
84
-
85
-
86
-
87
-
88
-
89
-
90
-
91
-
92
-
93
-
94
-
95
-
96
-
97
-
98
-
99
-
100
-
101
-
102
-
103
-
104
-
105
-
106
-
107
-
108
-
109
-
110
-
111
-
112
-
113
-
114
-
115
-
116
-
117
-
118
-
119
-
120
-
121
-
122
-
123
-
124
-
125
-
126
-
127
-
128
-
129
-
130
-
131
-
132
-
133
-
134
-
135
-
136
-
137
-
138
-
139
-
140
-
141
-
142
-
143
-
144
-
145
-
146
-
147
-
148
-
149
-
150
-
151
-
152
-
153
-
154
-
155
-
156
-
157
-
158
-
159
-
160
-
161
-
162
-
163
-
164
-
165
-
166
-
167
-
168
-
169
-
170
-
171
-
172
-
173
-
174
-
175
-
176
-
177
-
178
-
179
-
180
-
181
-
182
-
183
-
184
-
185
-
186
-
187
-
188
-
189
-
190
-
191
-
192
-
193
-
194
-
195
-
196
-
197
-
198
-
199
-
200
-
201
-
202
-
203
-
204
-
205
-
206
-
207
-
208
-
209
-
210
-
211
-
212
-
213
-
214
-
215
-
216
-
217
-
218
-
219
-
220
-
221
-
222
-
223
-
224
-
225
-
226
-
227
-
228
-
229
-
230
-
231
-
232
-
233
-
234
-
235
-
236
-
237
-
238
-
239
-
240
-
241
-
242
-
243
-
244
-
245
-
246
-
247
-
248
-
249
-
250
-
251
-
252
-
253
-
254
-
255
-
256
-
257
-
258
-
259
-
260
-
261
-
262
-
263
-
264
-
265
-
266
-
267
-
268
-
269
-
270
-
271
-
272
-
273
-
274
-
275
-
276
-
277
-
278
-
279
-
280
-
281
-
282
-
283
-
284
-
285
-
286
-
287
-
288
-
289
-
290
-
291
-
292
-
293
-
294
-
295
-
296
-
297
-
298
-
299
-
300
-
301
-
302
-
303
-
304
-
305
-
306
-
307
-
308
-
309
-
310
-
311
-
312
-
313
-
314
-
315
-
316
-
317
-
318
-
319
-
320
-
321
-
322
-
323
-
324
-
325
-
326
-
327
-
328
-
329
-
330
-
331
-
332
-
333
-
334
-
335
-
336
-
337
-
338
-
339
-
340
-
341
-
342
-
343
-
344
-
345
-
346
-
347
-
348
-
349
-
350
-
351
-
352
-
353
-
354
-
355
-
356
-
357
-
358
-
359
-
360
-
361
-
362
-
363
-
364
-
365
-
366
-
367
-
368
-
369
-
370
-
371
-
372
-
373
-
374
-
375
-
376
-
377
-
378
-
379
-
380
-
381
-
382
-
383
-
384
-
385
-
386
-
387
-
388
-
389
-
390
-
391
-
392
-
393
-
394
-
395
-
396
-
397
-
398
-
399
-
400
-
401
-
402
-
403
-
404
-
405
-
406
-
407
-
408
-
409
-
410
-
411
-
412
-
413
-
414
-
415
-
416
-
417
-
418
-
419
-
420
-
421
-
422
-
423
-
424
-
425
-
426
-
427
-
428
-
429
-
430
-
431
-
432
-
433
-
434
-
435
-
436
-
437
-
438
-
439
-
440
-
441
-
442
-
443
-
444
-
445
-
446
-
447
-
448
-
449
-
450
-
451
-
452
-
453
-
454
-
455
-
456
-
457
-
458
 |
 |
39
demand continued to constrain German GDP
growth, which slowed from 1.1 per cent in 2004 to
0.9 per cent in 2005, despite a strong increase in
exports, particularly capital goods. Eurozone
inflation averaged a little over 2 per cent in 2005,
with higher energy prices boosting inflation by
around 0.5 per cent. The European Central Bank
raised interest rates from 2.0 per cent to 2.25 per cent
in early December, the first increase for almost five
years.
The performance of the Turkish economy in
2005 remained very positive. GDP grew by
approximately 5.5 per cent, while inflation continued
to fall, to 7.7 per cent in December from 9.7 per cent
a year earlier. Economic policy remained anchored
by the government’s agreement with the IMF.
Turkey’s current account deficit, which reached
US$23.1 billion, or approximately 6.3 per cent of
GDP in 2005, is increasingly being financed by
longer-term foreign direct investment into the
country, which should help reduce Turkey’s
vulnerability to a sudden reversal in short-term
capital flows.
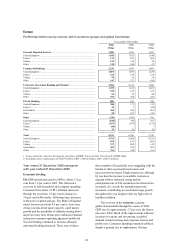
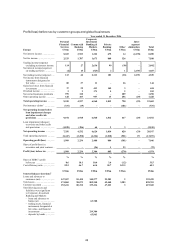
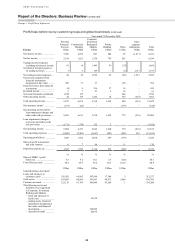
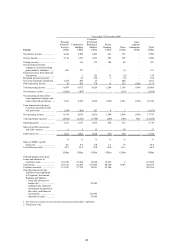
Review of business performance
European operations reported a pre-tax profit of
US$6,356 million compared with US$5,756 million
in 2004, an increase of 10 per cent. IFRSs changes to
the treatment of preference share dividends led to a
US$275 million reduction in pre-tax profits. On an
underlying basis, pre-tax profits grew by 25 per cent
and represented around 30 per cent of HSBC’s
equivalent total profits. In the UK, strong revenue
growth in Personal Financial Services and good cost
discipline were partially tempered by a weaker credit
experience. A quadrupling of pre-tax profits in
Turkey reflected the strong growth in customer
acquisition and retention achieved in the country. In
Commercial Banking, HSBC’s strong service
proposition attracted a 5 per cent growth in
customers with consequent growth in deposits,
receivables and service revenues. Corporate,
Investment Banking and Markets delivered strong
revenue growth in Europe, notably in client-related
trading activities, Global Transaction Banking and
securities services. In aggregate, European
Corporate, Investment Banking and Markets’
revenues grew by 15 per cent against a 9 per cent
increase in operating expenses.
The commentary that follows is on an
underlying basis.
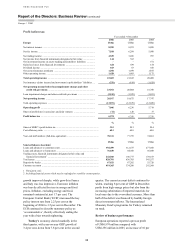
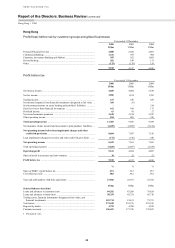
Personal Financial Services reported a pre-tax
profit of US$1,932 million, an increase of 16 per
cent compared with 2004, driven by revenue growth
and productivity improvements in the UK and
expansion in Turkey, where pre-tax profit more than
quadrupled to US$134 million. In France, revenue
growth benefited from the rebranding of CCF and
four subsidiary banks to ‘HSBC France’, with a
notable increase in international products,
particularly mortgage lending to overseas customers.
Continued emphasis was placed on streamlining
the business to improve productivity, and on sales
and channel management, particularly in the UK,
where one third of sales were made through direct
channels in 2005. Attention was also paid to further
simplifying HSBC’s product range in the UK, and on
integrating the Marks and Spencer (‘M&S’) Money
business in its first full year since acquisition. A
number of innovative marketing campaigns and
promotions during 2005 heightened brand
awareness, leading to greater customer consideration
of HSBC products. This was evidenced in strong
balance growth and market share gains across most
major product lines. In Turkey, an emphasis on
business expansion and customer acquisition
delivered increased card sales and utilisation
combined with higher mortgage sales. In France,
marketing campaigns in conjunction with the
rebranding exercise boosted mortgage lending and
sales of insurance and investment products.
Net interest income increased by 10 per cent to
US$5,309 million. This arose substantially in the UK
through increases in mortgage and credit card
lending, and in Turkey, mainly in credit cards.
Increased net interest income from balance sheet
growth in France was offset by spread compression.
Despite a more subdued housing market, net
interest income from UK mortgages increased by
37 per cent, driven by balance growth of 22 per cent
and improvements in customer retention. Spreads
also increased, reflecting the inclusion from
1 January 2005 of fee income within the effective
interest rate calculation under IFRSs. New lending
was strongest in the first time buyer market, where
successful pricing and marketing strategies helped
gain market share of new sales in a market which
contracted overall.
Net interest income from UK credit cards
increased by 24 per cent, driven by balance growth
and the IFRSs impact noted above. Increased card
utilisation by existing customers, as well as new
customers attracted by competitive pricing,
marketing and cross-sales, contributed to an increase
of 16 per cent in average balances. HSBC-branded
cards increased market share of new cards issued;
sales of the John Lewis branded credit card also
increased. Income benefited from the roll-off of