HSBC 2006 Annual Report Download - page 148
Download and view the complete annual report
Please find page 148 of the 2006 HSBC annual report below. You can navigate through the pages in the report by either clicking on the pages listed below, or by using the keyword search tool below to find specific information within the annual report.-
 1
1 -
2
-
3
-
4
-
5
-
6
-
7
-
8
-
9
-
10
-
11
-
12
-
13
-
14
-
15
-
16
-
17
-
18
-
19
-
20
-
21
-
22
-
23
-
24
-
25
-
26
-
27
-
28
-
29
-
30
-
31
-
32
-
33
-
34
-
35
-
36
-
37
-
38
-
39
-
40
-
41
-
42
-
43
-
44
-
45
-
46
-
47
-
48
-
49
-
50
-
51
-
52
-
53
-
54
-
55
-
56
-
57
-
58
-
59
-
60
-
61
-
62
-
63
-
64
-
65
-
66
-
67
-
68
-
69
-
70
-
71
-
72
-
73
-
74
-
75
-
76
-
77
-
78
-
79
-
80
-
81
-
82
-
83
-
84
-
85
-
86
-
87
-
88
-
89
-
90
-
91
-
92
-
93
-
94
-
95
-
96
-
97
-
98
-
99
-
100
-
101
-
102
-
103
-
104
-
105
-
106
-
107
-
108
-
109
-
110
-
111
-
112
-
113
-
114
-
115
-
116
-
117
-
118
-
119
-
120
-
121
-
122
-
123
-
124
-
125
-
126
-
127
-
128
-
129
-
130
-
131
-
132
-
133
-
134
-
135
-
136
-
137
-
 138
138 -
 139
139 -
 140
140 -
 141
141 -
 142
142 -
 143
143 -
 144
144 -
 145
145 -
 146
146 -
 147
147 -
 148
148 -
 149
149 -
 150
150 -
 151
151 -
 152
152 -
 153
153 -
 154
154 -
 155
155 -
 156
156 -
 157
157 -
 158
158 -
159
-
160
-
161
-
162
-
163
-
164
-
165
-
166
-
167
-
168
-
169
-
170
-
171
-
172
-
173
-
174
-
175
-
176
-
177
-
178
-
179
-
180
-
181
-
182
-
183
-
184
-
185
-
186
-
187
-
188
-
189
-
190
-
191
-
192
-
193
-
194
-
195
-
196
-
197
-
198
-
199
-
200
-
201
-
202
-
203
-
204
-
205
-
206
-
207
-
208
-
209
-
210
-
211
-
212
-
213
-
214
-
215
-
216
-
217
-
218
-
219
-
220
-
221
-
222
-
223
-
224
-
225
-
226
-
227
-
228
-
229
-
230
-
231
-
232
-
233
-
234
-
235
-
236
-
237
-
238
-
239
-
240
-
241
-
242
-
243
-
244
-
245
-
246
-
247
-
248
-
249
-
250
-
251
-
252
-
253
-
254
-
255
-
256
-
257
-
258
-
259
-
260
-
261
-
262
-
263
-
264
-
265
-
266
-
267
-
268
-
269
-
270
-
271
-
272
-
273
-
274
-
275
-
276
-
277
-
278
-
279
-
280
-
281
-
282
-
283
-
284
-
285
-
286
-
287
-
288
-
289
-
290
-
291
-
292
-
293
-
294
-
295
-
296
-
297
-
298
-
299
-
300
-
301
-
302
-
303
-
304
-
305
-
306
-
307
-
308
-
309
-
310
-
311
-
312
-
313
-
314
-
315
-
316
-
317
-
318
-
319
-
320
-
321
-
322
-
323
-
324
-
325
-
326
-
327
-
328
-
329
-
330
-
331
-
332
-
333
-
334
-
335
-
336
-
337
-
338
-
339
-
340
-
341
-
342
-
343
-
344
-
345
-
346
-
347
-
348
-
349
-
350
-
351
-
352
-
353
-
354
-
355
-
356
-
357
-
358
-
359
-
360
-
361
-
362
-
363
-
364
-
365
-
366
-
367
-
368
-
369
-
370
-
371
-
372
-
373
-
374
-
375
-
376
-
377
-
378
-
379
-
380
-
381
-
382
-
383
-
384
-
385
-
386
-
387
-
388
-
389
-
390
-
391
-
392
-
393
-
394
-
395
-
396
-
397
-
398
-
399
-
400
-
401
-
402
-
403
-
404
-
405
-
406
-
407
-
408
-
409
-
410
-
411
-
412
-
413
-
414
-
415
-
416
-
417
-
418
-
419
-
420
-
421
-
422
-
423
-
424
-
425
-
426
-
427
-
428
-
429
-
430
-
431
-
432
-
433
-
434
-
435
-
436
-
437
-
438
-
439
-
440
-
441
-
442
-
443
-
444
-
445
-
446
-
447
-
448
-
449
-
450
-
451
-
452
-
453
-
454
-
455
-
456
-
457
-
458
 |
 |

HSBC HOLDINGS PLC
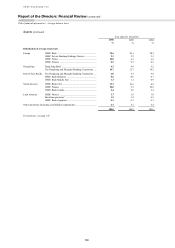
Report of the Directors: Financial Review (continued)
Economic profit / Other financial information
146
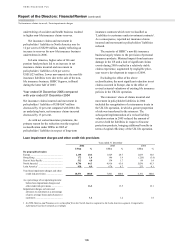
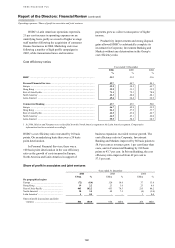
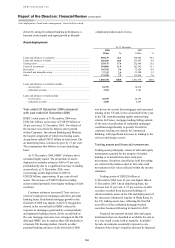
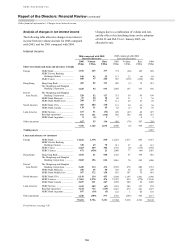
Economic profit
HSBC’s internal performance measures include
economic profit, a calculation which compares the
return on financial capital invested in HSBC by its
shareholders with the cost of that capital. HSBC
prices its cost of capital internally and the difference
between that cost and post-tax profit attributable to
ordinary shareholders represents the amount of
economic profit generated. Economic profit is used
by management as a means of deciding where to
allocate resources so that they will be most
productive.
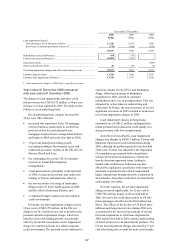
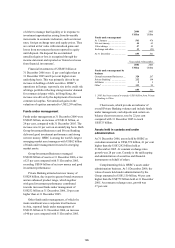
In order to concentrate on external factors rather
than measurement bases, HSBC emphasises the trend
in economic profit within business units rather than
absolute amounts. In light of the current levels of
world interest rates, and taking into account its
geographical and customer group diversification,
HSBC believes that its true cost of capital on a
consolidated basis remains 10 per cent. HSBC plans
to continue using this rate until the end of the current
five-year strategic plan in 2008 in order to ensure
consistency and comparability.
Economic profit decreased by US$418 million,
or 7 per cent compared with 2005. The rate of growth
in profit attributable was slower than the growth in
average shareholders’ equity, mainly due to increased
loan impairment charges in the US mortgage service
business. This was also reflected in a lower return on
average invested capital and in consequence
economic spread, which fell by 1 percentage point
compared with 2005.
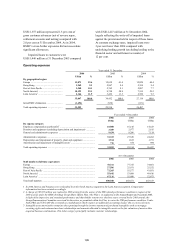
Year ended 31 December
2006 2005
US$m %1 US$m %1
Average total shareholders’ equity ......................................................... 100,860 89,589
Add: Goodwill previously amortised or written off ............................... 8,172 8,172
Less: Property revaluation reserves ........................................................ (1,062) (1,092)
Reserves representing unrealised gains on
effective cash flow hedges ......................................................... (126) (315)
Reserves representing unrealised gains on
available-for-sale securities ....................................................... (1,156) (1,294)
Preference shares ........................................................................... (1,405) (351)
Average invested capital2 ........................................................................ 105,283 94,709
Return on invested capital3 ..................................................................... 15,699 14.9 15,060 15.9
Benchmark cost of capital ...................................................................... (10,528) (10.0) (9,471) (10.0)
Economic profit/spread .......................................................................... 5,171 4.9 5,589 5.9
1 Expressed as a percentage of average invested capital.
2 Average invested capital is measured as average total shareholders’ equity after:
– adding back the average balance of goodwill impaired or amortised pre transition to IFRS or subsequent written-off, directly to
reserves;
– deducting the average balance of HSBC’s revaluation surplus relating to property held for own use. This reserve was generated when
determining the deemed carrying cost of such properties on transition to IFRS and will run down over time as the properties are sold;
– deducting average preference shares issued by HSBC Holdings, and;
– deducting average reserves for unrealised gains/(losses) on effective cash flow hedges and available-for-sale securities.
3 Return on invested capital is based on the profit attributable to ordinary shareholders of the parent company.