HSBC 2006 Annual Report Download - page 51
Download and view the complete annual report
Please find page 51 of the 2006 HSBC annual report below. You can navigate through the pages in the report by either clicking on the pages listed below, or by using the keyword search tool below to find specific information within the annual report.-
 1
1 -
2
-
3
-
4
-
5
-
6
-
7
-
8
-
9
-
10
-
11
-
12
-
13
-
14
-
15
-
16
-
17
-
18
-
19
-
20
-
21
-
22
-
23
-
24
-
25
-
26
-
27
-
28
-
29
-
30
-
31
-
32
-
33
-
34
-
35
-
36
-
37
-
38
-
39
-
40
-
 41
41 -
 42
42 -
 43
43 -
 44
44 -
 45
45 -
 46
46 -
 47
47 -
 48
48 -
 49
49 -
 50
50 -
 51
51 -
 52
52 -
 53
53 -
 54
54 -
 55
55 -
 56
56 -
 57
57 -
 58
58 -
 59
59 -
 60
60 -
 61
61 -
62
-
63
-
64
-
65
-
66
-
67
-
68
-
69
-
70
-
71
-
72
-
73
-
74
-
75
-
76
-
77
-
78
-
79
-
80
-
81
-
82
-
83
-
84
-
85
-
86
-
87
-
88
-
89
-
90
-
91
-
92
-
93
-
94
-
95
-
96
-
97
-
98
-
99
-
100
-
101
-
102
-
103
-
104
-
105
-
106
-
107
-
108
-
109
-
110
-
111
-
112
-
113
-
114
-
115
-
116
-
117
-
118
-
119
-
120
-
121
-
122
-
123
-
124
-
125
-
126
-
127
-
128
-
129
-
130
-
131
-
132
-
133
-
134
-
135
-
136
-
137
-
138
-
139
-
140
-
141
-
142
-
143
-
144
-
145
-
146
-
147
-
148
-
149
-
150
-
151
-
152
-
153
-
154
-
155
-
156
-
157
-
158
-
159
-
160
-
161
-
162
-
163
-
164
-
165
-
166
-
167
-
168
-
169
-
170
-
171
-
172
-
173
-
174
-
175
-
176
-
177
-
178
-
179
-
180
-
181
-
182
-
183
-
184
-
185
-
186
-
187
-
188
-
189
-
190
-
191
-
192
-
193
-
194
-
195
-
196
-
197
-
198
-
199
-
200
-
201
-
202
-
203
-
204
-
205
-
206
-
207
-
208
-
209
-
210
-
211
-
212
-
213
-
214
-
215
-
216
-
217
-
218
-
219
-
220
-
221
-
222
-
223
-
224
-
225
-
226
-
227
-
228
-
229
-
230
-
231
-
232
-
233
-
234
-
235
-
236
-
237
-
238
-
239
-
240
-
241
-
242
-
243
-
244
-
245
-
246
-
247
-
248
-
249
-
250
-
251
-
252
-
253
-
254
-
255
-
256
-
257
-
258
-
259
-
260
-
261
-
262
-
263
-
264
-
265
-
266
-
267
-
268
-
269
-
270
-
271
-
272
-
273
-
274
-
275
-
276
-
277
-
278
-
279
-
280
-
281
-
282
-
283
-
284
-
285
-
286
-
287
-
288
-
289
-
290
-
291
-
292
-
293
-
294
-
295
-
296
-
297
-
298
-
299
-
300
-
301
-
302
-
303
-
304
-
305
-
306
-
307
-
308
-
309
-
310
-
311
-
312
-
313
-
314
-
315
-
316
-
317
-
318
-
319
-
320
-
321
-
322
-
323
-
324
-
325
-
326
-
327
-
328
-
329
-
330
-
331
-
332
-
333
-
334
-
335
-
336
-
337
-
338
-
339
-
340
-
341
-
342
-
343
-
344
-
345
-
346
-
347
-
348
-
349
-
350
-
351
-
352
-
353
-
354
-
355
-
356
-
357
-
358
-
359
-
360
-
361
-
362
-
363
-
364
-
365
-
366
-
367
-
368
-
369
-
370
-
371
-
372
-
373
-
374
-
375
-
376
-
377
-
378
-
379
-
380
-
381
-
382
-
383
-
384
-
385
-
386
-
387
-
388
-
389
-
390
-
391
-
392
-
393
-
394
-
395
-
396
-
397
-
398
-
399
-
400
-
401
-
402
-
403
-
404
-
405
-
406
-
407
-
408
-
409
-
410
-
411
-
412
-
413
-
414
-
415
-
416
-
417
-
418
-
419
-
420
-
421
-
422
-
423
-
424
-
425
-
426
-
427
-
428
-
429
-
430
-
431
-
432
-
433
-
434
-
435
-
436
-
437
-
438
-
439
-
440
-
441
-
442
-
443
-
444
-
445
-
446
-
447
-
448
-
449
-
450
-
451
-
452
-
453
-
454
-
455
-
456
-
457
-
458
 |
 |
49
Year ended 31 December 2006 compared
with year ended 31 December 2005
Economic briefing
Hong Kong experienced sustained economic
expansion in the second half of 2006 with growth,
particularly in exports, regaining momentum
following a mild slowdown in the second quarter.
Domestic demand underpinned the economy
throughout 2006 despite volatility in the stock
market, which suffered a correction in the second
quarter but recovered strongly in the second half of
the year. Falling unemployment, improved
household incomes and positive longer-term
economic prospects were the key elements
supporting domestic consumption. Hong Kong’s
unemployment rate fell to a six-year low of 4.4 per
cent towards the end of 2006, and the labour market
began to tighten in certain sectors, with wage
pressure increasingly evident. Despite this, inflation
remained low, averaging 2 per cent in 2006.
Investment growth surged in the second half of the
year as the local interest rate cycle peaked. The
residential property market divided, with prices of
luxury property exceeding levels last seen in the
boom in 1997 while, elsewhere in the sector, activity
and prices remained flat. At the same time,
investment in the construction sector was weak in
the absence of large-scale infrastructure projects and
general uncertainty. Externally, trade performance
improved in the second half of 2006 following
difficulties in the first half of the year due to volatile
external demand from western markets.
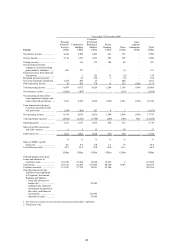
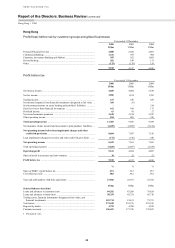
Review of business performance
HSBC’s operations in Hong Kong reported a pre-tax
profit of US$5,182 million compared with
US$4,517 million in 2005, an increase of 15 per
cent. On an underlying basis, pre-tax profit also grew
by 15 per cent. Underlying net operating income
increased by 14 per cent, driven by widening deposit
spreads in Personal Financial Services and
Commercial Banking and strong net fee income
growth in all customer groups. In Corporate,
Investment Banking and Markets, an increase in
trading income offset the negative impact of lower
balance sheet management income. Underlying
operating expenses rose by 14 per cent.
The following commentary is on an underlying
basis.
Personal Financial Services pre-tax profits
increased by 9 per cent to US$2,880 million. Net
operating income before impairment charges grew
by 13 per cent, driven by higher income from
savings and current accounts and increased fee
income. Marketing activities were successful,
helping HSBC enlarge its share of the credit card
and mortgage markets and attract higher deposit
balances. As a result, customer numbers increased
by over 100,000. The cost efficiency ratio improved
by 1.1 percentage points as cost growth of 9 per cent
was restricted to less than the increase in net
revenue. Credit quality remained favourable and
loan impairment charges were low, although higher
than in 2005 when a modest recovery was recorded.
Net interest income of US$2,882 million was
10 per cent higher than in 2005, principally as a
result of deposit growth and wider liability spreads.
Average savings balances increased by 7 per cent to
US$119 billion, reflecting the success of
promotional campaigns and HSBC’s competitive
pricing strategy, and supported by increased demand
for deposit products in the rising interest rate
environment. Effective deposit pricing amid rising
interest rates led to wider deposit spreads.
HSBC increased its share of new mortgage
business to 33 per cent, the highest of any lender,
benefiting from the launch of a simplified,
transparent pricing structure in the first half of
2006 which was supported by extensive media
coverage. The relaunch of a number of key products
and the introduction of a two-month interest free
offer in the fourth quarter of 2006 also contributed to
the increase in market share. Excluding the reduction
in balances under the Government Home Ownership
Scheme (‘GHOS’), HSBC’s mortgage portfolio grew
by 7 per cent to US$23 billion.
Average cardholder balances increased by
16 per cent to US$3.5 billion and HSBC issued over
1 million new cards during 2006, which led to a
17 per cent rise in cards in issue to a record
4.6 million. The launch of a mass card acquisition
programme comprising increased promotional
activity, direct marketing and the use of incentives to
increase cardholder spending contributed directly to
this rise. As a result, HSBC’s share of the Hong
Kong credit card market increased to 46 per cent of
card receivable balances.
Net fee income increased by 32 per cent to
US$977 million. Buoyant regional and global stock
markets led to increased demand for equity-based
products among local investors and HSBC
responded by launching 69 new investment funds,
including a number of innovative fund products,
designed to meet investors’ changing demands in a
rising interest rate environment. These launches
were supported by greater marketing activity,
improved pricing transparency and the development
of new customer retention activities. As a result,