HSBC 2006 Annual Report Download - page 133
Download and view the complete annual report
Please find page 133 of the 2006 HSBC annual report below. You can navigate through the pages in the report by either clicking on the pages listed below, or by using the keyword search tool below to find specific information within the annual report.-
 1
1 -
2
-
3
-
4
-
5
-
6
-
7
-
8
-
9
-
10
-
11
-
12
-
13
-
14
-
15
-
16
-
17
-
18
-
19
-
20
-
21
-
22
-
23
-
24
-
25
-
26
-
27
-
28
-
29
-
30
-
31
-
32
-
33
-
34
-
35
-
36
-
37
-
38
-
39
-
40
-
41
-
42
-
43
-
44
-
45
-
46
-
47
-
48
-
49
-
50
-
51
-
52
-
53
-
54
-
55
-
56
-
57
-
58
-
59
-
60
-
61
-
62
-
63
-
64
-
65
-
66
-
67
-
68
-
69
-
70
-
71
-
72
-
73
-
74
-
75
-
76
-
77
-
78
-
79
-
80
-
81
-
82
-
83
-
84
-
85
-
86
-
87
-
88
-
89
-
90
-
91
-
92
-
93
-
94
-
95
-
96
-
97
-
98
-
99
-
100
-
101
-
102
-
103
-
104
-
105
-
106
-
107
-
108
-
109
-
110
-
111
-
112
-
113
-
114
-
115
-
116
-
117
-
118
-
119
-
120
-
121
-
122
-
 123
123 -
 124
124 -
 125
125 -
 126
126 -
 127
127 -
 128
128 -
 129
129 -
 130
130 -
 131
131 -
 132
132 -
 133
133 -
 134
134 -
 135
135 -
 136
136 -
 137
137 -
 138
138 -
 139
139 -
 140
140 -
 141
141 -
 142
142 -
 143
143 -
144
-
145
-
146
-
147
-
148
-
149
-
150
-
151
-
152
-
153
-
154
-
155
-
156
-
157
-
158
-
159
-
160
-
161
-
162
-
163
-
164
-
165
-
166
-
167
-
168
-
169
-
170
-
171
-
172
-
173
-
174
-
175
-
176
-
177
-
178
-
179
-
180
-
181
-
182
-
183
-
184
-
185
-
186
-
187
-
188
-
189
-
190
-
191
-
192
-
193
-
194
-
195
-
196
-
197
-
198
-
199
-
200
-
201
-
202
-
203
-
204
-
205
-
206
-
207
-
208
-
209
-
210
-
211
-
212
-
213
-
214
-
215
-
216
-
217
-
218
-
219
-
220
-
221
-
222
-
223
-
224
-
225
-
226
-
227
-
228
-
229
-
230
-
231
-
232
-
233
-
234
-
235
-
236
-
237
-
238
-
239
-
240
-
241
-
242
-
243
-
244
-
245
-
246
-
247
-
248
-
249
-
250
-
251
-
252
-
253
-
254
-
255
-
256
-
257
-
258
-
259
-
260
-
261
-
262
-
263
-
264
-
265
-
266
-
267
-
268
-
269
-
270
-
271
-
272
-
273
-
274
-
275
-
276
-
277
-
278
-
279
-
280
-
281
-
282
-
283
-
284
-
285
-
286
-
287
-
288
-
289
-
290
-
291
-
292
-
293
-
294
-
295
-
296
-
297
-
298
-
299
-
300
-
301
-
302
-
303
-
304
-
305
-
306
-
307
-
308
-
309
-
310
-
311
-
312
-
313
-
314
-
315
-
316
-
317
-
318
-
319
-
320
-
321
-
322
-
323
-
324
-
325
-
326
-
327
-
328
-
329
-
330
-
331
-
332
-
333
-
334
-
335
-
336
-
337
-
338
-
339
-
340
-
341
-
342
-
343
-
344
-
345
-
346
-
347
-
348
-
349
-
350
-
351
-
352
-
353
-
354
-
355
-
356
-
357
-
358
-
359
-
360
-
361
-
362
-
363
-
364
-
365
-
366
-
367
-
368
-
369
-
370
-
371
-
372
-
373
-
374
-
375
-
376
-
377
-
378
-
379
-
380
-
381
-
382
-
383
-
384
-
385
-
386
-
387
-
388
-
389
-
390
-
391
-
392
-
393
-
394
-
395
-
396
-
397
-
398
-
399
-
400
-
401
-
402
-
403
-
404
-
405
-
406
-
407
-
408
-
409
-
410
-
411
-
412
-
413
-
414
-
415
-
416
-
417
-
418
-
419
-
420
-
421
-
422
-
423
-
424
-
425
-
426
-
427
-
428
-
429
-
430
-
431
-
432
-
433
-
434
-
435
-
436
-
437
-
438
-
439
-
440
-
441
-
442
-
443
-
444
-
445
-
446
-
447
-
448
-
449
-
450
-
451
-
452
-
453
-
454
-
455
-
456
-
457
-
458
 |
 |

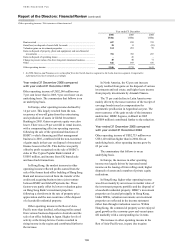
131
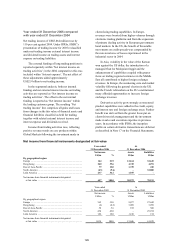
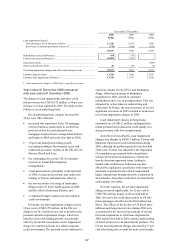
values of assets. The increase in the fair value of
liabilities under investment contracts was 10 per cent
lower than in 2005.
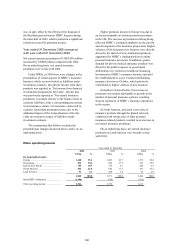
Year ended 31 December 2005 compared
with year ended 31 December 2004
The introduction of the new categories of financial
instruments under IAS 39 on 1 January 2005 has led
to a change in income statement presentation for the
results of HSBC’s life insurance business. In 2005,
income from assets designated at fair value and held
to meet liabilities under insurance and investment
contracts of US$1,760 million is reported under ‘Net
income from financial instruments designated at fair
value’. In 2004, the corresponding amounts were
reported within ‘Net investment income on assets
backing policyholders’ liabilities’.
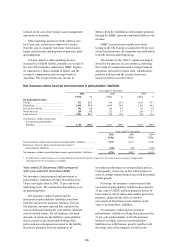
Income from assets designated at fair value and
held to meet liabilities under insurance and
investment contracts during 2005 was correlated with
increases in liabilities under the related investment
and insurance contracts. Under IFRSs, only
investment contracts can be designated as financial
instruments. Changes in the liability under these
contracts, therefore, like the related assets, were
included within the heading ‘Net income from
financial instruments designated at fair value’. The
element of the increase in liabilities under insurance
contracts that reflected investment performance was
reported separately within ‘Net insurance claims
incurred and movements in policyholders’ liabilities’.
In 2004, investment income on assets backing
policyholder liabilities was offset against the
movement in policyholders’ liabilities without
distinction between insurance and investment
contracts.
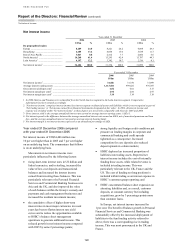
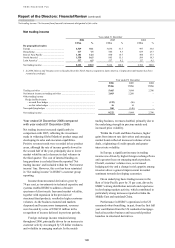
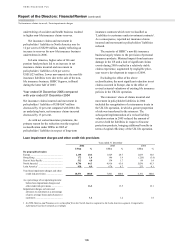
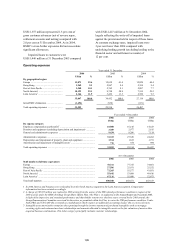
Gains less losses from financial investments
Year ended 31 December
2006 2005 2004
US$m % US$m % US$m %
By geographical region
Europe ...................................................... 624 64.4 439 63.4 154 28.5
Hong Kong .............................................. 162 16.7 108 15.6 175 32.4
Rest of Asia-Pacific ................................. 41 4.2 18 2.6 17 3.1
North America1 ........................................ 58 6.0 47 6.8 147 27.3
Latin America1 ......................................... 84 8.7 80 11.6 47 8.7
Gains less losses from financial
investments .......................................... 969
100.0
692 100.0 540 100.0
Year ended 31 December
2006
US$m
2005
US$m
2004
US$m
Net gain from disposal of:
– debt securities ............................................................................................... 252 138 202
– equity securities ............................................................................................ 702 505 296
– other financial investments ........................................................................... 15 7 42
969 650 540
Recovery of impairment losses ....................................................................... – 42 –
Gains less losses from financial investments .................................................. 969 692 540
1 In 2006, Mexico and Panama were reclassified from the North America segment to Latin America. Comparative information has been
restated accordingly.
Year ended 31 December 2006 compared
with year ended 31 December 2005
HSBC reported net gains of US$969 million from
the disposal of available-for-sale financial
investments during 2006, 40 per cent higher than in
2005. On an underlying basis, gains were 35 per cent
greater than in 2005. Gains from financial
investments were mainly attributable to the
following transactions:
• a gain of US$93 million arising from the partial
redemption of HSBC’s investment in
MasterCard Incorporated following its IPO in
May. The gain was distributed across all
geographic regions as most HSBC Group banks
were members of MasterCard;
• a gain of US$101 million on the sale of part of
HSBC’s stake in UTI Bank Limited, an Indian
retail bank;