HSBC 2006 Annual Report Download - page 224
Download and view the complete annual report
Please find page 224 of the 2006 HSBC annual report below. You can navigate through the pages in the report by either clicking on the pages listed below, or by using the keyword search tool below to find specific information within the annual report.-
 1
1 -
2
-
3
-
4
-
5
-
6
-
7
-
8
-
9
-
10
-
11
-
12
-
13
-
14
-
15
-
16
-
17
-
18
-
19
-
20
-
21
-
22
-
23
-
24
-
25
-
26
-
27
-
28
-
29
-
30
-
31
-
32
-
33
-
34
-
35
-
36
-
37
-
38
-
39
-
40
-
41
-
42
-
43
-
44
-
45
-
46
-
47
-
48
-
49
-
50
-
51
-
52
-
53
-
54
-
55
-
56
-
57
-
58
-
59
-
60
-
61
-
62
-
63
-
64
-
65
-
66
-
67
-
68
-
69
-
70
-
71
-
72
-
73
-
74
-
75
-
76
-
77
-
78
-
79
-
80
-
81
-
82
-
83
-
84
-
85
-
86
-
87
-
88
-
89
-
90
-
91
-
92
-
93
-
94
-
95
-
96
-
97
-
98
-
99
-
100
-
101
-
102
-
103
-
104
-
105
-
106
-
107
-
108
-
109
-
110
-
111
-
112
-
113
-
114
-
115
-
116
-
117
-
118
-
119
-
120
-
121
-
122
-
123
-
124
-
125
-
126
-
127
-
128
-
129
-
130
-
131
-
132
-
133
-
134
-
135
-
136
-
137
-
138
-
139
-
140
-
141
-
142
-
143
-
144
-
145
-
146
-
147
-
148
-
149
-
150
-
151
-
152
-
153
-
154
-
155
-
156
-
157
-
158
-
159
-
160
-
161
-
162
-
163
-
164
-
165
-
166
-
167
-
168
-
169
-
170
-
171
-
172
-
173
-
174
-
175
-
176
-
177
-
178
-
179
-
180
-
181
-
182
-
183
-
184
-
185
-
186
-
187
-
188
-
189
-
190
-
191
-
192
-
193
-
194
-
195
-
196
-
197
-
198
-
199
-
200
-
201
-
202
-
203
-
204
-
205
-
206
-
207
-
208
-
209
-
210
-
211
-
212
-
213
-
 214
214 -
 215
215 -
 216
216 -
 217
217 -
 218
218 -
 219
219 -
 220
220 -
 221
221 -
 222
222 -
 223
223 -
 224
224 -
 225
225 -
 226
226 -
 227
227 -
 228
228 -
 229
229 -
 230
230 -
 231
231 -
 232
232 -
 233
233 -
 234
234 -
235
-
236
-
237
-
238
-
239
-
240
-
241
-
242
-
243
-
244
-
245
-
246
-
247
-
248
-
249
-
250
-
251
-
252
-
253
-
254
-
255
-
256
-
257
-
258
-
259
-
260
-
261
-
262
-
263
-
264
-
265
-
266
-
267
-
268
-
269
-
270
-
271
-
272
-
273
-
274
-
275
-
276
-
277
-
278
-
279
-
280
-
281
-
282
-
283
-
284
-
285
-
286
-
287
-
288
-
289
-
290
-
291
-
292
-
293
-
294
-
295
-
296
-
297
-
298
-
299
-
300
-
301
-
302
-
303
-
304
-
305
-
306
-
307
-
308
-
309
-
310
-
311
-
312
-
313
-
314
-
315
-
316
-
317
-
318
-
319
-
320
-
321
-
322
-
323
-
324
-
325
-
326
-
327
-
328
-
329
-
330
-
331
-
332
-
333
-
334
-
335
-
336
-
337
-
338
-
339
-
340
-
341
-
342
-
343
-
344
-
345
-
346
-
347
-
348
-
349
-
350
-
351
-
352
-
353
-
354
-
355
-
356
-
357
-
358
-
359
-
360
-
361
-
362
-
363
-
364
-
365
-
366
-
367
-
368
-
369
-
370
-
371
-
372
-
373
-
374
-
375
-
376
-
377
-
378
-
379
-
380
-
381
-
382
-
383
-
384
-
385
-
386
-
387
-
388
-
389
-
390
-
391
-
392
-
393
-
394
-
395
-
396
-
397
-
398
-
399
-
400
-
401
-
402
-
403
-
404
-
405
-
406
-
407
-
408
-
409
-
410
-
411
-
412
-
413
-
414
-
415
-
416
-
417
-
418
-
419
-
420
-
421
-
422
-
423
-
424
-
425
-
426
-
427
-
428
-
429
-
430
-
431
-
432
-
433
-
434
-
435
-
436
-
437
-
438
-
439
-
440
-
441
-
442
-
443
-
444
-
445
-
446
-
447
-
448
-
449
-
450
-
451
-
452
-
453
-
454
-
455
-
456
-
457
-
458
 |
 |

HSBC HOLDINGS PLC
Report of the Directors: The Management of Risk (continued)
Market risk > Sensitivity of NII / Structural foreign exchange / HSBC Holdings
222
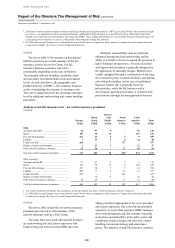
HSBC’s exposure to the effect of movements in
interest rates on its net interest income arise in three
main areas: core deposit franchises, HSBC Finance
and Global Markets.
• Core deposit franchises: these are exposed to
changes in the value of deposits raised and
spreads on wholesale funds. In a low interest
rate environment, the value of core deposits
increases as interest rates rise and decreases as
interest rates fall. This risk is asymmetrical in a
very low interest rate environment, however, as
there is limited room to lower deposit pricing in
the event of interest rate reductions.
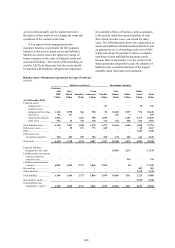
• HSBC Finance offsets the sensitivity of the core
deposit franchises to interest rate reductions.
This arises from the fact that HSBC Finance has
a substantial fixed rate, real estate secured,
lending portfolio which is primarily funded with
interest rate sensitive short-term liabilities.
• Residual interest rate risk is managed within
Global Markets. This reflects the Group’s policy
of transferring all interest rate risk to Global
Markets to be managed within defined limits
and with flexibility as to the instruments used.
The main influences on the sensitivity of the
Group’s net interest income to the changes in interest
rates tabulated above are as follows:
• Global Markets decreased its exposure to US
dollar assets in non-trading portfolios and the
average life of certain assets in HSBC Finance
fell as they neared expected maturity, both of
which contributed to the decreased sensitivity in
this currency to both rising and falling rates.
• Growth in sterling net trading assets, the
funding for which is generally sourced from
short-term retail deposits and recorded in net
interest income but the income from which is
recorded in net trading income, has contributed
to the increased sensitivity to both rising and
falling rates in this currency.
• Global Markets also reduced its exposure to
euro assets in non-trading portfolios which
decreased the net interest income sensitivity in
this currency. However, this decrease was offset
by an increase in euro net trading assets.
It can be seen from the above that projecting the
movement in net interest income from prospective
changes in interest rates is a complex interaction of
structural and managed exposures. In a rising rate
environment, the most critical exposures are those
managed within Global Markets.
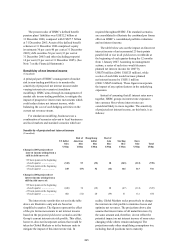
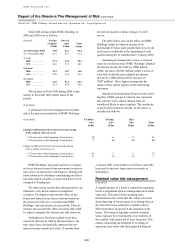
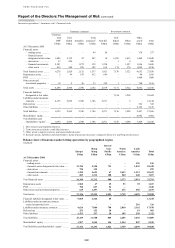
HSBC monitors the sensitivity of reported
reserves to interest rate movements on a monthly
basis by assessing the expected reduction in
valuation of available-for-sale portfolios and cash
flow hedges due to parallel movements of plus or
minus 100 basis points in all yield curves. The table
below describes the sensitivity of HSBC’s reported
reserves to these movements at the end of 2006 and
2005 and the maximum and minimum month-end
figures during these years:
Sensitivity of reported reserves to interest rate movements
(Unaudited)
US$m
Maximum
impact
US$m
Minimum
impact
US$m
At 31 December 2006
+ 100 basis point parallel move in all yield curves.......................................... (1,558) (2,015) (1,358)
As a percentage of total shareholders’ equity ................................................. (1.4%) (1.9%) (1.3%)
- 100 basis point parallel move in all yield curves........................................... 1,456 1,944 1,270
As a percentage of total shareholders’ equity ................................................. 1.3% 1.8% 1.2%
At 31 December 2005
+ 100 basis point parallel move in all yield curves.......................................... (1,918) (2,655) (1,918)
As a percentage of total shareholders’ equity ................................................. (2.0%) (2.8%) (2.0%)
- 100 basis point parallel move in all yield curves........................................... 1,877 2,543 1,877
As a percentage of total shareholders’ equity ................................................. 2.0% 2.7% 2.0%