HSBC 2006 Annual Report Download - page 187
Download and view the complete annual report
Please find page 187 of the 2006 HSBC annual report below. You can navigate through the pages in the report by either clicking on the pages listed below, or by using the keyword search tool below to find specific information within the annual report.-
 1
1 -
2
-
3
-
4
-
5
-
6
-
7
-
8
-
9
-
10
-
11
-
12
-
13
-
14
-
15
-
16
-
17
-
18
-
19
-
20
-
21
-
22
-
23
-
24
-
25
-
26
-
27
-
28
-
29
-
30
-
31
-
32
-
33
-
34
-
35
-
36
-
37
-
38
-
39
-
40
-
41
-
42
-
43
-
44
-
45
-
46
-
47
-
48
-
49
-
50
-
51
-
52
-
53
-
54
-
55
-
56
-
57
-
58
-
59
-
60
-
61
-
62
-
63
-
64
-
65
-
66
-
67
-
68
-
69
-
70
-
71
-
72
-
73
-
74
-
75
-
76
-
77
-
78
-
79
-
80
-
81
-
82
-
83
-
84
-
85
-
86
-
87
-
88
-
89
-
90
-
91
-
92
-
93
-
94
-
95
-
96
-
97
-
98
-
99
-
100
-
101
-
102
-
103
-
104
-
105
-
106
-
107
-
108
-
109
-
110
-
111
-
112
-
113
-
114
-
115
-
116
-
117
-
118
-
119
-
120
-
121
-
122
-
123
-
124
-
125
-
126
-
127
-
128
-
129
-
130
-
131
-
132
-
133
-
134
-
135
-
136
-
137
-
138
-
139
-
140
-
141
-
142
-
143
-
144
-
145
-
146
-
147
-
148
-
149
-
150
-
151
-
152
-
153
-
154
-
155
-
156
-
157
-
158
-
159
-
160
-
161
-
162
-
163
-
164
-
165
-
166
-
167
-
168
-
169
-
170
-
171
-
172
-
173
-
174
-
175
-
176
-
 177
177 -
 178
178 -
 179
179 -
 180
180 -
 181
181 -
 182
182 -
 183
183 -
 184
184 -
 185
185 -
 186
186 -
 187
187 -
 188
188 -
 189
189 -
 190
190 -
 191
191 -
 192
192 -
 193
193 -
 194
194 -
 195
195 -
 196
196 -
 197
197 -
198
-
199
-
200
-
201
-
202
-
203
-
204
-
205
-
206
-
207
-
208
-
209
-
210
-
211
-
212
-
213
-
214
-
215
-
216
-
217
-
218
-
219
-
220
-
221
-
222
-
223
-
224
-
225
-
226
-
227
-
228
-
229
-
230
-
231
-
232
-
233
-
234
-
235
-
236
-
237
-
238
-
239
-
240
-
241
-
242
-
243
-
244
-
245
-
246
-
247
-
248
-
249
-
250
-
251
-
252
-
253
-
254
-
255
-
256
-
257
-
258
-
259
-
260
-
261
-
262
-
263
-
264
-
265
-
266
-
267
-
268
-
269
-
270
-
271
-
272
-
273
-
274
-
275
-
276
-
277
-
278
-
279
-
280
-
281
-
282
-
283
-
284
-
285
-
286
-
287
-
288
-
289
-
290
-
291
-
292
-
293
-
294
-
295
-
296
-
297
-
298
-
299
-
300
-
301
-
302
-
303
-
304
-
305
-
306
-
307
-
308
-
309
-
310
-
311
-
312
-
313
-
314
-
315
-
316
-
317
-
318
-
319
-
320
-
321
-
322
-
323
-
324
-
325
-
326
-
327
-
328
-
329
-
330
-
331
-
332
-
333
-
334
-
335
-
336
-
337
-
338
-
339
-
340
-
341
-
342
-
343
-
344
-
345
-
346
-
347
-
348
-
349
-
350
-
351
-
352
-
353
-
354
-
355
-
356
-
357
-
358
-
359
-
360
-
361
-
362
-
363
-
364
-
365
-
366
-
367
-
368
-
369
-
370
-
371
-
372
-
373
-
374
-
375
-
376
-
377
-
378
-
379
-
380
-
381
-
382
-
383
-
384
-
385
-
386
-
387
-
388
-
389
-
390
-
391
-
392
-
393
-
394
-
395
-
396
-
397
-
398
-
399
-
400
-
401
-
402
-
403
-
404
-
405
-
406
-
407
-
408
-
409
-
410
-
411
-
412
-
413
-
414
-
415
-
416
-
417
-
418
-
419
-
420
-
421
-
422
-
423
-
424
-
425
-
426
-
427
-
428
-
429
-
430
-
431
-
432
-
433
-
434
-
435
-
436
-
437
-
438
-
439
-
440
-
441
-
442
-
443
-
444
-
445
-
446
-
447
-
448
-
449
-
450
-
451
-
452
-
453
-
454
-
455
-
456
-
457
-
458
 |
 |

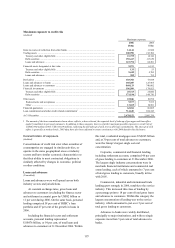
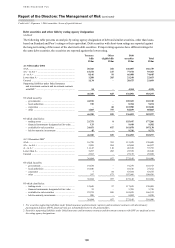
185
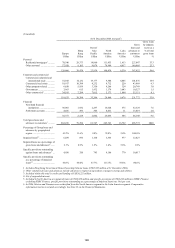
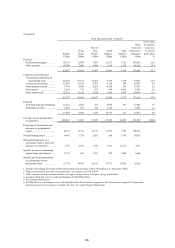
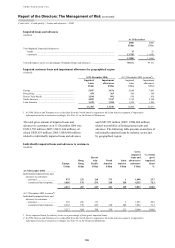
(Unaudited)
At 31 December 20022 (restated6)
Europe
Hong
Kong
Rest of
Asia-
Pacific
North
America
Latin
America
Gross
loans and
advances to
customers
Gross loans
by industry
sector as a
% of total
gross loans
US$m US$m US$m US$m US$m US$m %
Personal
Residential mortgages1 ............ 38,719 31,094 7,507 25,127 1,792 104,239 28.9
Other personal ......................... 26,748 7,066 5,900 6,514 2,334 48,562 13.4
65,467 38,160 13,407 31,641 4,126 152,801 42.3
Corporate and commercial
Commercial, industrial and
international trade ...............
44,424 10,173 12,582 8,706 3,130 79,015 21.8
Commercial real estate ............ 11,887 8,336 2,701 6,158 185 29,267 8.1
Other property-related ............. 3,970 4,805 2,031 4,250 291 15,347 4.2
Government ............................. 2,164 719 933 446 4,691 8,953 2.5
Other commercial3 ................... 22,712 6,612 5,950 3,925 1,475 40,674 11.2
85,157 30,645 24,197 23,485 9,772 173,256 47.8
Financial
Non-bank financial institutions 15,221 2,055 931 8,953 327 27,487 7.6
Settlement accounts ................. 2,622 347 192 5,224 – 8,385 2.3
17,843 2,402 1,123 14,177 327 35,872 9.9
Total gross loans and advances
to customers4 ............................
168,467 71,207 38,727 69,303 14,225
361,929 100.0
Percentage of Group loans and
advances by geographical
region........................................ 46.5% 19.7% 10.7% 19.2% 3.9% 100.0%
Non-performing loans5 ................ 4,495 1,724 2,055 508 1,741 10,523
Non-performing loans as a
percentage of gross loans and
advances to customers5 ............ 2.7% 2.4% 5.3% 0.7% 12.2% 2.9%
Specific provisions outstanding
against loans and advances ..... 2,774 688 1,321 222 1,601 6,606
Specific provisions outstanding
as a percentage of non-
performing loans5 ..................... 61.7% 39.9% 64.3% 43.7% 92.0% 62.8%
1 Includes Hong Kong Government Home Ownership Scheme loans (US$7,255 million at 31 December 2002).
2 Figures presented in this table were prepared in accordance with UK GAAP.
3 Other commercial loans include advances in respect of agriculture, transport, energy and utilities.
4 Included within this total is credit card lending of US$9,950 million.
5 Net of suspended interest.
6 In 2006, Mexico and Panama were reclassified from the North America segment to the Latin America segment. Comparative
information has been restated accordingly. See Note 13 on the Financial Statements.