Dollar General 2015 Annual Report Download - page 99
Download and view the complete annual report
Please find page 99 of the 2015 Dollar General annual report below. You can navigate through the pages in the report by either clicking on the pages listed below, or by using the keyword search tool below to find specific information within the annual report.-
 1
1 -
2
-
3
-
4
-
5
-
6
-
7
-
8
-
9
-
10
-
11
-
12
-
13
-
14
-
15
-
16
-
17
-
18
-
19
-
20
-
21
-
22
-
23
-
24
-
25
-
26
-
27
-
28
-
29
-
30
-
31
-
32
-
33
-
34
-
35
-
36
-
37
-
38
-
39
-
40
-
41
-
42
-
43
-
44
-
45
-
46
-
47
-
48
-
49
-
50
-
51
-
52
-
53
-
54
-
55
-
56
-
57
-
58
-
59
-
60
-
61
-
62
-
63
-
64
-
65
-
66
-
67
-
68
-
69
-
70
-
71
-
72
-
73
-
74
-
75
-
76
-
77
-
78
-
79
-
80
-
81
-
82
-
83
-
84
-
85
-
86
-
87
-
88
-
 89
89 -
 90
90 -
 91
91 -
 92
92 -
 93
93 -
 94
94 -
 95
95 -
 96
96 -
 97
97 -
 98
98 -
 99
99 -
 100
100 -
 101
101 -
 102
102 -
 103
103 -
 104
104 -
 105
105 -
 106
106 -
 107
107 -
 108
108 -
 109
109 -
110
-
111
-
112
-
113
-
114
-
115
-
116
-
117
-
118
-
119
-
120
-
121
-
122
-
123
-
124
-
125
-
126
-
127
-
128
-
129
-
130
-
131
-
132
-
133
-
134
-
135
-
136
-
137
-
138
-
139
-
140
-
141
-
142
-
143
-
144
-
145
-
146
-
147
-
148
-
149
-
150
-
151
-
152
-
153
-
154
-
155
-
156
-
157
-
158
-
159
-
160
-
161
-
162
-
163
-
164
-
165
-
166
-
167
-
168
 |
 |

10-K
transportation efficiencies, global sourcing, and pricing and markdown optimization. With respect
to category management, the mix of sales affects profitability because the gross margin
associated with sales within our consumables category generally is lower than that associated
with sales within our non-consumables categories. Even within each category, however, there are
varying levels of gross margin associated with the specific items. With respect to inventory shrink
reduction, the progress in 2015 was broad-based with shrink declining across all four product
categories. For a discussion of the sales mix, as well as the results of certain other margin-
related initiatives in 2015, see ‘‘Results of Operations’’ below.
The degree of success of these initiatives is often reflected in our same-store sales results and in
the level of improvement in shopper frequency and number of items sold and average transaction
amount. For the 2015 fourth quarter, we believe these ongoing initiatives helped to drive the
same-store sales growth in three out of our four product categories, reflecting increases in both
customer traffic and average transaction amount for the 32nd consecutive quarter when compared to the
prior year quarter.
To support our other operating priorities we also are focused on capturing growth opportunities and
innovating within our channel. We continued to expand our store count, opening 730 stores during 2015.
We also have continued our store remodeling efforts and remodeled or relocated a total of 881 stores
during 2015. In fiscal 2016, we have plans to open 900 stores and to relocate or remodel 875 stores, and we
plan to maintain our accelerated square footage growth of approximately six to eight percent during 2017.
We continue to innovate within our channel, and during 2016 we will implement the DG16 store format.
This store format will include additional cooler doors, a redesigned queueing area, and other enhancements
that are focused on meeting the evolving demands of our core customer while also delivering on our
operating priorities. In addition, we are testing a smaller format store (less than 6,000 square feet) which
we believe could allow us to capture growth opportunities in metropolitan areas.
We have established a position as a low-cost operator, continuously seeking ways to control costs that
do not affect our customer’s shopping experience. We have enhanced this position during the latter part of
2015 and into 2016 through our zero-based budgeting initiative, streamlining our business while also
reducing expenses. Our goal is to lower the same-store sales growth required to leverage selling, general
and administrative (‘‘SG&A’’) expenses. As part of this initiative we reduced approximately 255 positions
within our corporate support function in the third quarter of 2015 and expect to reinvest a portion of these
savings in the business as we deem appropriate. In addition, at the store level, we remain committed to
simplifying or eliminating various tasks so that those time savings can be reinvested by our store managers
in other areas such as ensuring customer service, improved in-stock levels, and improved store standards.
We will continue to seek additional opportunities to enhance our low-cost position.
Our employees are a competitive advantage, and we are always searching for ways to continue
investing in them. Our training programs are continually evolving, as we work to ensure that our
employees have the tools necessary to be successful in their positions. We invest in our employees in an
effort to create an environment that attracts and retains talented personnel, as we believe that,
particularly at the store level, employees who are promoted from within generally have longer tenures
and are greater contributors to improvements in our financial performance. Furthermore, we believe
that reducing our store manager turnover likely results in improved store financial performance in
areas such as shrink and sales. We have also implemented training programs for high-potential
employees, and believe that these and other efforts will produce a more stable, engaged workforce.
Our continued focus on these four operating priorities, coupled with strong cash flow management
and share repurchases resulted in solid overall operating and financial performance in 2015 as
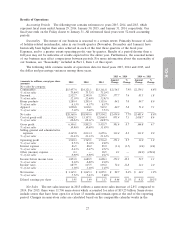
compared to 2014 as follows. Basis points, as referred to below, are equal to 0.01 percent of net sales.
• Net sales in 2015 increased 7.7% over 2014. Sales in same-stores increased 2.8%, with increases
in both customer traffic and average transaction amount. Consumables represented 76% of sales
25