Dollar General 2015 Annual Report Download - page 100
Download and view the complete annual report
Please find page 100 of the 2015 Dollar General annual report below. You can navigate through the pages in the report by either clicking on the pages listed below, or by using the keyword search tool below to find specific information within the annual report.-
 1
1 -
2
-
3
-
4
-
5
-
6
-
7
-
8
-
9
-
10
-
11
-
12
-
13
-
14
-
15
-
16
-
17
-
18
-
19
-
20
-
21
-
22
-
23
-
24
-
25
-
26
-
27
-
28
-
29
-
30
-
31
-
32
-
33
-
34
-
35
-
36
-
37
-
38
-
39
-
40
-
41
-
42
-
43
-
44
-
45
-
46
-
47
-
48
-
49
-
50
-
51
-
52
-
53
-
54
-
55
-
56
-
57
-
58
-
59
-
60
-
61
-
62
-
63
-
64
-
65
-
66
-
67
-
68
-
69
-
70
-
71
-
72
-
73
-
74
-
75
-
76
-
77
-
78
-
79
-
80
-
81
-
82
-
83
-
84
-
85
-
86
-
87
-
88
-
89
-
 90
90 -
 91
91 -
 92
92 -
 93
93 -
 94
94 -
 95
95 -
 96
96 -
 97
97 -
 98
98 -
 99
99 -
 100
100 -
 101
101 -
 102
102 -
 103
103 -
 104
104 -
 105
105 -
 106
106 -
 107
107 -
 108
108 -
 109
109 -
 110
110 -
111
-
112
-
113
-
114
-
115
-
116
-
117
-
118
-
119
-
120
-
121
-
122
-
123
-
124
-
125
-
126
-
127
-
128
-
129
-
130
-
131
-
132
-
133
-
134
-
135
-
136
-
137
-
138
-
139
-
140
-
141
-
142
-
143
-
144
-
145
-
146
-
147
-
148
-
149
-
150
-
151
-
152
-
153
-
154
-
155
-
156
-
157
-
158
-
159
-
160
-
161
-
162
-
163
-
164
-
165
-
166
-
167
-
168
 |
 |

10-K
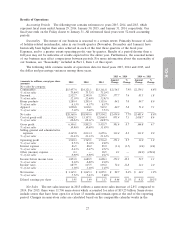
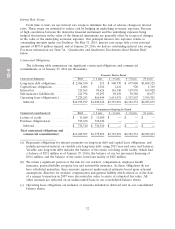
in 2015. Departments with the most significant increases in net sales were candy and snacks,
perishables, tobacco, and food. Average sales per square foot in 2015 were $226, up from $223
in 2014.
• Operating profit increased 9.7% to $1.94 billion, or 9.5% of sales, compared to $1.77 billion, or
9.4% of sales in 2014. The increase in our operating profit rate was attributable to a 27 basis-
point increase in our gross profit rate, which was partially offset by a 10 basis-point increase in
SG&A.
• Our gross profit rate increased by 27 basis points due primarily to lower transportation costs and
a lower rate of inventory shrinkage.
• The increase in SG&A, as a percentage of sales, was due primarily to increases in incentive
compensation expense, repairs and maintenance expense and occupancy costs. For other factors,
see the detailed discussion that follows.
• Interest expense decreased by $1.3 million in 2015 to $86.9 million. Total long-term obligations
as of January 29, 2016 were $2.97 billion.
• We reported net income of $1.17 billion, or $3.95 per diluted share, for 2015, compared to net
income of $1.07 billion, or $3.49 per diluted share, for 2014. Stock repurchase activity during
2014 and 2015 contributed to the increase in diluted earnings per share.
• We generated approximately $1.38 billion of cash flows from operating activities in 2015, an
increase of 4.8% compared to 2014. We primarily utilized our cash flows from operating
activities to invest in the growth of our business, repurchase our common stock, and pay
quarterly cash dividends.
• Inventory turnover was 4.7 times on a rolling four-quarter basis. Inventories increased 4.3% on a
per store basis over 2014.
• During 2015 we opened 730 new stores, remodeled or relocated 881 stores, and closed 36 stores.
Also in 2015, we repurchased approximately 17.6 million shares of our outstanding common stock
for $1.3 billion.
In 2016, we plan to continue to focus on our four key operating priorities. We expect our sales
growth in 2016 to again be driven primarily by consumables, although we expect non-consumables sales
to continue to contribute to our profitable sales growth. Same-store sales growth is key to achieving our
objectives, and we have implemented targeted actions to drive same-store sales in 2016, such as
updating our customer segmentation to gain deeper insights into the spending habits for each of our
core customer segments. This helps drive our category management process, as we optimize our
assortment and expand into those categories that are most likely to drive traffic to our stores. Our
continued focus on on-shelf availability and affordability also should assist in growing transactions and
number of items sold. Our new store format will offer a total of 22 cooler doors, an increase of six
cooler doors as compared to our previous new store format and will be utilized for all new stores,
relocations and remodels.
Other key 2016 initiatives include our zero-based budgeting initiative, which we expect to take
costs out of the business that do not affect the customer experience, ongoing supply chain
improvements, and investing in our people. In addition, we plan to continue to repurchase shares of
our common stock and pay quarterly cash dividends, subject to Board discretion, to further enhance
shareholder return. However, we are facing potential regulatory changes relating to overtime
exemptions under the Fair Labor Standards Act, which, if implemented, are expected to increase our
labor costs and negatively affect our operating results.
Readers should refer to the detailed discussion of our operating results below for additional comments
on financial performance in the current year periods as compared with the prior year periods.
26