Dollar General 2015 Annual Report Download - page 167
Download and view the complete annual report
Please find page 167 of the 2015 Dollar General annual report below. You can navigate through the pages in the report by either clicking on the pages listed below, or by using the keyword search tool below to find specific information within the annual report.-
 1
1 -
2
-
3
-
4
-
5
-
6
-
7
-
8
-
9
-
10
-
11
-
12
-
13
-
14
-
15
-
16
-
17
-
18
-
19
-
20
-
21
-
22
-
23
-
24
-
25
-
26
-
27
-
28
-
29
-
30
-
31
-
32
-
33
-
34
-
35
-
36
-
37
-
38
-
39
-
40
-
41
-
42
-
43
-
44
-
45
-
46
-
47
-
48
-
49
-
50
-
51
-
52
-
53
-
54
-
55
-
56
-
57
-
58
-
59
-
60
-
61
-
62
-
63
-
64
-
65
-
66
-
67
-
68
-
69
-
70
-
71
-
72
-
73
-
74
-
75
-
76
-
77
-
78
-
79
-
80
-
81
-
82
-
83
-
84
-
85
-
86
-
87
-
88
-
89
-
90
-
91
-
92
-
93
-
94
-
95
-
96
-
97
-
98
-
99
-
100
-
101
-
102
-
103
-
104
-
105
-
106
-
107
-
108
-
109
-
110
-
111
-
112
-
113
-
114
-
115
-
116
-
117
-
118
-
119
-
120
-
121
-
122
-
123
-
124
-
125
-
126
-
127
-
128
-
129
-
130
-
131
-
132
-
133
-
134
-
135
-
136
-
137
-
138
-
139
-
140
-
141
-
142
-
143
-
144
-
145
-
146
-
147
-
148
-
149
-
150
-
151
-
152
-
153
-
154
-
155
-
156
-
 157
157 -
 158
158 -
 159
159 -
 160
160 -
 161
161 -
 162
162 -
 163
163 -
 164
164 -
 165
165 -
 166
166 -
 167
167 -
 168
168
 |
 |

ANNUAL MEETING
Dollar General Corporation’s annual meeting of share-
holders is scheduled for 9:00 a.m. Central Time on
Wednesday May 25, 2016, at:
Goodlettsville City Hall Auditorium
105 South Main Street, Goodlettsville, TN 37072
Shareholders of record as of March 17, 2016 are entitled
to vote at the meeting.
NYSE: DG
The common stock of Dollar General Corporation is
traded on the New York Stock Exchange under the trading
symbol “DG.” The number of shareholders of record as of
March 17, 2016 was 1,879.
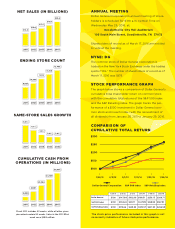
STOCK PERFORMANCE GRAPH
The graph below shows a comparison of Dollar General’s
cumulative total shareholder return on common stock
with the cumulative total returns of the S&P 500 index
and the S&P Retailing index. The graph tracks the per-
formance of a $100 investment in Dollar General com-
mon stock and in each index (with the reinvestment of
all dividends) from January 28, 2011 to January 29, 2016.
COMPARISON OF
CUMULATIVE TOTAL RETURN
The stock price performance included in this graph is not
necessarily indicative of future stock price performance.
S&P Retailing IndexS&P 500 Index
$150
$20
0
$10
0
$250
$30
0
1/28/11 2/3/12 2/1/13 1/31/141/30/15
1/29/16
Dollar General Corporation
$147.68
$115.66
$104.22 $121.71
$149.35
$162.96 $198.31
$147.89
$189.57
$236.13
$168.93
$227.53
$266.71
$167.81
$266.59
Dollar General
S&P 500 Index
S&P Retailing Index
$100
$100
$100
1/28/11 2/3/122/1/13 1/31/14 1/30/15 1/29/16
$20.4
2015
$14.8
2011
$16.0
2012
$17.5
2013
$18.9
2014
11,789
2014
12,483
2015
9,937
2011
10,506
2012
11,132
2013
$4,709
2014
$6,087
2015
$1,050
2011
$2,181
2012
$3,394
2013
2.8%
2014
2.8%
2015
6.0%
2011
4.7%
2012
3.3%
2013
NET SALES (IN BILLIONS)
ENDING STORE COUNT
SAME-STORE SALES GROWTH
Fiscal 2011 includes 53 weeks, while all other years
presented contain 52 weeks. Sales in the 2011 53rd
week were $289 million.
41
0
28
22
28
41
CUMULATIVE CASH FROM
OPERATIONS (IN MILLIONS)
12,483