Dollar General 2015 Annual Report Download - page 120
Download and view the complete annual report
Please find page 120 of the 2015 Dollar General annual report below. You can navigate through the pages in the report by either clicking on the pages listed below, or by using the keyword search tool below to find specific information within the annual report.-
 1
1 -
2
-
3
-
4
-
5
-
6
-
7
-
8
-
9
-
10
-
11
-
12
-
13
-
14
-
15
-
16
-
17
-
18
-
19
-
20
-
21
-
22
-
23
-
24
-
25
-
26
-
27
-
28
-
29
-
30
-
31
-
32
-
33
-
34
-
35
-
36
-
37
-
38
-
39
-
40
-
41
-
42
-
43
-
44
-
45
-
46
-
47
-
48
-
49
-
50
-
51
-
52
-
53
-
54
-
55
-
56
-
57
-
58
-
59
-
60
-
61
-
62
-
63
-
64
-
65
-
66
-
67
-
68
-
69
-
70
-
71
-
72
-
73
-
74
-
75
-
76
-
77
-
78
-
79
-
80
-
81
-
82
-
83
-
84
-
85
-
86
-
87
-
88
-
89
-
90
-
91
-
92
-
93
-
94
-
95
-
96
-
97
-
98
-
99
-
100
-
101
-
102
-
103
-
104
-
105
-
106
-
107
-
108
-
109
-
 110
110 -
 111
111 -
 112
112 -
 113
113 -
 114
114 -
 115
115 -
 116
116 -
 117
117 -
 118
118 -
 119
119 -
 120
120 -
 121
121 -
 122
122 -
 123
123 -
 124
124 -
 125
125 -
 126
126 -
 127
127 -
 128
128 -
 129
129 -
 130
130 -
131
-
132
-
133
-
134
-
135
-
136
-
137
-
138
-
139
-
140
-
141
-
142
-
143
-
144
-
145
-
146
-
147
-
148
-
149
-
150
-
151
-
152
-
153
-
154
-
155
-
156
-
157
-
158
-
159
-
160
-
161
-
162
-
163
-
164
-
165
-
166
-
167
-
168
 |
 |

10-K
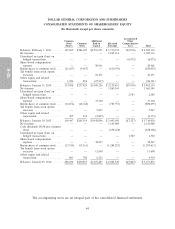
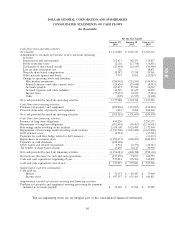
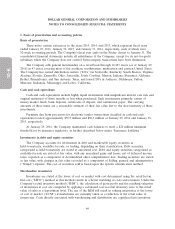
DOLLAR GENERAL CORPORATION AND SUBSIDIARIES
NOTES TO CONSOLIDATED FINANCIAL STATEMENTS
1. Basis of presentation and accounting policies
Basis of presentation
These notes contain references to the years 2015, 2014, and 2013, which represent fiscal years
ended January 29, 2016, January 30, 2015, and January 31, 2014, respectively, each of which were
52-week accounting periods. The Company’s fiscal year ends on the Friday closest to January 31. The
consolidated financial statements include all subsidiaries of the Company, except for its not-for-profit
subsidiary which the Company does not control. Intercompany transactions have been eliminated.
The Company sells general merchandise on a retail basis through 12,483 stores (as of January 29,
2016) in 43 states covering most of the southern, southwestern, midwestern and eastern United States.
The Company has owned distribution centers (‘‘DCs’’) in Scottsville, Kentucky; South Boston, Virginia;
Alachua, Florida; Zanesville, Ohio; Jonesville, South Carolina; Marion, Indiana; Bessemer, Alabama;
Bethel, Pennsylvania; and San Antonio, Texas, and leased DCs in Ardmore, Oklahoma; Fulton,
Missouri; Indianola, Mississippi; and Lebec, California.
Cash and cash equivalents
Cash and cash equivalents include highly liquid investments with insignificant interest rate risk and
original maturities of three months or less when purchased. Such investments primarily consist of
money market funds, bank deposits, certificates of deposit, and commercial paper. The carrying
amounts of these items are a reasonable estimate of their fair value due to the short maturity of these
investments.
Payments due from processors for electronic tender transactions classified as cash and cash
equivalents totaled approximately $59.5 million and $58.5 million at January 29, 2016 and January 30,
2015, respectively.
At January 29, 2016, the Company maintained cash balances to meet a $20 million minimum
threshold set by insurance regulators, as further described below under ‘‘Insurance liabilities.’’
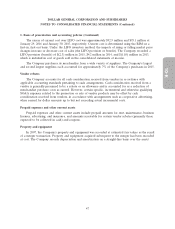
Investments in debt and equity securities
The Company accounts for investments in debt and marketable equity securities as
held-to-maturity, available-for-sale, or trading, depending on their classification. Debt securities
categorized as held-to-maturity are stated at amortized cost. Debt and equity securities categorized as
available-for-sale are stated at fair value, with any unrealized gains and losses, net of deferred income
taxes, reported as a component of Accumulated other comprehensive loss. Trading securities are stated
at fair value, with changes in fair value recorded as a component of Selling, general and administrative
(‘‘SG&A’’) expense. The cost of securities sold is based upon the specific identification method.
Merchandise inventories
Inventories are stated at the lower of cost or market with cost determined using the retail last-in,
first-out (‘‘LIFO’’) method as this method results in a better matching of costs and revenues. Under the
Company’s retail inventory method (‘‘RIM’’), the calculation of gross profit and the resulting valuation
of inventories at cost are computed by applying a calculated cost-to-retail inventory ratio to the retail
value of sales at a department level. The use of the RIM will result in valuing inventories at the lower
of cost or market (‘‘LCM’’) if markdowns are currently taken as a reduction of the retail value of
inventories. Costs directly associated with warehousing and distribution are capitalized into inventory.
46