Dollar General 2015 Annual Report Download - page 103
Download and view the complete annual report
Please find page 103 of the 2015 Dollar General annual report below. You can navigate through the pages in the report by either clicking on the pages listed below, or by using the keyword search tool below to find specific information within the annual report.-
 1
1 -
2
-
3
-
4
-
5
-
6
-
7
-
8
-
9
-
10
-
11
-
12
-
13
-
14
-
15
-
16
-
17
-
18
-
19
-
20
-
21
-
22
-
23
-
24
-
25
-
26
-
27
-
28
-
29
-
30
-
31
-
32
-
33
-
34
-
35
-
36
-
37
-
38
-
39
-
40
-
41
-
42
-
43
-
44
-
45
-
46
-
47
-
48
-
49
-
50
-
51
-
52
-
53
-
54
-
55
-
56
-
57
-
58
-
59
-
60
-
61
-
62
-
63
-
64
-
65
-
66
-
67
-
68
-
69
-
70
-
71
-
72
-
73
-
74
-
75
-
76
-
77
-
78
-
79
-
80
-
81
-
82
-
83
-
84
-
85
-
86
-
87
-
88
-
89
-
90
-
91
-
92
-
 93
93 -
 94
94 -
 95
95 -
 96
96 -
 97
97 -
 98
98 -
 99
99 -
 100
100 -
 101
101 -
 102
102 -
 103
103 -
 104
104 -
 105
105 -
 106
106 -
 107
107 -
 108
108 -
 109
109 -
 110
110 -
 111
111 -
 112
112 -
 113
113 -
114
-
115
-
116
-
117
-
118
-
119
-
120
-
121
-
122
-
123
-
124
-
125
-
126
-
127
-
128
-
129
-
130
-
131
-
132
-
133
-
134
-
135
-
136
-
137
-
138
-
139
-
140
-
141
-
142
-
143
-
144
-
145
-
146
-
147
-
148
-
149
-
150
-
151
-
152
-
153
-
154
-
155
-
156
-
157
-
158
-
159
-
160
-
161
-
162
-
163
-
164
-
165
-
166
-
167
-
168
 |
 |

10-K
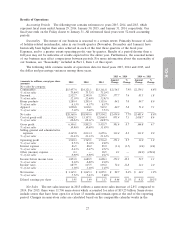
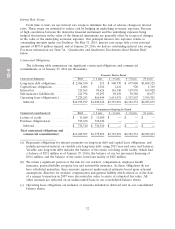
Interest Expense. Interest expense decreased $1.3 million to $86.9 million in 2015 compared to
2014. See the detailed discussion under ‘‘Liquidity and Capital Resources’’ regarding the financing of
various long-term obligations.
Interest expense remained relatively constant in 2014 compared to 2013.
We had outstanding variable-rate debt of $686.6 million and $62.0 million as of January 29, 2016
and January 30, 2015, respectively, after taking into consideration the impact of interest rate swaps in
effect at January 30, 2015. The remainder of our outstanding indebtedness at January 29, 2016 and
January 30, 2015 was fixed rate debt.
Other (Income) Expense. In 2015, we recorded pretax losses of $0.3 million related to the
refinancing of long-term debt. In 2013, we recorded pretax losses of $18.9 million resulting from the
termination of our senior secured credit facilities.
Income Taxes. The effective income tax rates for 2015, 2014 and 2013 were expenses of 37.1%,
36.6% and 37.0%, respectively.
The effective income tax rate for 2015 was 37.1% compared to a rate of 36.6% for 2014 which
represents a net increase of 0.5 percentage points. The effective income tax rate was lower in 2014 due
principally to federal and state reserve releases in 2014 that did not reoccur, to the same extent, in
2015. As in prior years, we receive a significant income tax benefit related to wages paid to certain
newly hired employees that qualify for federal jobs credits (principally the Work Opportunity Tax Credit
or ‘‘WOTC’’). In December 2015, Congress retroactively extended the federal law authorizing the
WOTC for the period from January 1, 2015 through December 31, 2019. Accordingly, based on current
law, the WOTC should be available for our 2016 through 2019 fiscal years.
The effective income tax rate for 2014 was 36.6% compared to a rate of 37.0% for 2013 which
represents a net decrease of 0.4 percentage points. The effective income tax rate decreased from 2013
due principally to the favorable resolution of state income tax examinations and other state income tax
reserves, which increased by a lesser amount in 2014 compared to 2013.
Off Balance Sheet Arrangements
The entities involved in the ownership structure underlying the leases for three of our distribution
centers meet the accounting definition of a Variable Interest Entity (‘‘VIE’’). One of these distribution
centers has been recorded as a financing obligation whereby its property and equipment are reflected
in our consolidated balance sheets. The land and buildings of the other two distribution centers have
been recorded as operating leases. We are not the primary beneficiary of these VIEs and, accordingly,
have not included these entities in our consolidated financial statements. Other than the foregoing, we
are not party to any material off balance sheet arrangements.
Effects of Inflation
We experienced little or no overall product cost inflation in 2015, 2014 and 2013.
Liquidity and Capital Resources
Current Financial Condition and Recent Developments
During the past three years, we have generated an aggregate of approximately $3.91 billion in cash
flows from operating activities and incurred approximately $1.42 billion in capital expenditures. During
that period, we expanded the number of stores we operate by 1,977, representing growth of
approximately 19%, and we remodeled or relocated 2,378 stores, or approximately 19% of the stores
we operated as of January 29, 2016. We intend to continue our current strategy of pursuing store
growth, remodels and relocations in 2016.
29