Dollar General 2015 Annual Report Download - page 101
Download and view the complete annual report
Please find page 101 of the 2015 Dollar General annual report below. You can navigate through the pages in the report by either clicking on the pages listed below, or by using the keyword search tool below to find specific information within the annual report.-
 1
1 -
2
-
3
-
4
-
5
-
6
-
7
-
8
-
9
-
10
-
11
-
12
-
13
-
14
-
15
-
16
-
17
-
18
-
19
-
20
-
21
-
22
-
23
-
24
-
25
-
26
-
27
-
28
-
29
-
30
-
31
-
32
-
33
-
34
-
35
-
36
-
37
-
38
-
39
-
40
-
41
-
42
-
43
-
44
-
45
-
46
-
47
-
48
-
49
-
50
-
51
-
52
-
53
-
54
-
55
-
56
-
57
-
58
-
59
-
60
-
61
-
62
-
63
-
64
-
65
-
66
-
67
-
68
-
69
-
70
-
71
-
72
-
73
-
74
-
75
-
76
-
77
-
78
-
79
-
80
-
81
-
82
-
83
-
84
-
85
-
86
-
87
-
88
-
89
-
90
-
 91
91 -
 92
92 -
 93
93 -
 94
94 -
 95
95 -
 96
96 -
 97
97 -
 98
98 -
 99
99 -
 100
100 -
 101
101 -
 102
102 -
 103
103 -
 104
104 -
 105
105 -
 106
106 -
 107
107 -
 108
108 -
 109
109 -
 110
110 -
 111
111 -
112
-
113
-
114
-
115
-
116
-
117
-
118
-
119
-
120
-
121
-
122
-
123
-
124
-
125
-
126
-
127
-
128
-
129
-
130
-
131
-
132
-
133
-
134
-
135
-
136
-
137
-
138
-
139
-
140
-
141
-
142
-
143
-
144
-
145
-
146
-
147
-
148
-
149
-
150
-
151
-
152
-
153
-
154
-
155
-
156
-
157
-
158
-
159
-
160
-
161
-
162
-
163
-
164
-
165
-
166
-
167
-
168
 |
 |

10-K
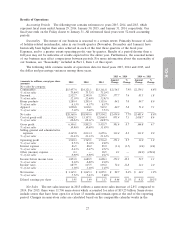
Results of Operations
Accounting Periods. The following text contains references to years 2015, 2014, and 2013, which
represent fiscal years ended January 29, 2016, January 30, 2015, and January 31, 2014, respectively. Our
fiscal year ends on the Friday closest to January 31. All referenced fiscal years were 52-week accounting
periods.
Seasonality. The nature of our business is seasonal to a certain extent. Primarily because of sales
of holiday-related merchandise, sales in our fourth quarter (November, December and January) have
historically been higher than sales achieved in each of the first three quarters of the fiscal year.
Expenses, and to a greater extent operating profit, vary by quarter. Results of a period shorter than a
full year may not be indicative of results expected for the entire year. Furthermore, the seasonal nature
of our business may affect comparisons between periods. For more information about the seasonality of
our business, see ‘‘Seasonality’’ included in Part 1, Item 1 of this report.
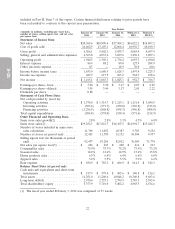
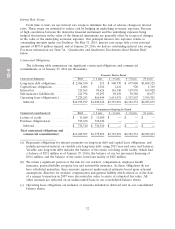
The following table contains results of operations data for fiscal years 2015, 2014 and 2013, and
the dollar and percentage variances among those years.
2015 vs. 2014 2014 vs. 2013
Amount % Amount %
(amounts in millions, except per share 2015 2014 2013 Change Change Change Change
amounts)
Net sales by category:
Consumables ................ $15,457.6 $14,321.1 $13,161.8 $1,136.5 7.9% $1,159.3 8.8%
% of net sales ............... 75.89% 75.73% 75.19%
Seasonal ................... 2,522.7 2,345.0 2,259.5 177.7 7.6 85.5 3.8
% of net sales ............... 12.39% 12.40% 12.91%
Home products .............. 1,289.4 1,205.4 1,115.6 84.1 7.0 89.7 8.0
% of net sales ............... 6.33% 6.37% 6.37%
Apparel ................... 1,098.8 1,038.1 967.2 60.7 5.8 71.0 7.3
% of net sales ............... 5.39% 5.49% 5.53%
Net sales .................. $20,368.6 $18,909.6 $17,504.2 $1,459.0 7.7% $1,405.4 8.0%
Cost of goods sold ............ 14,062.5 13,107.1 12,068.4 955.4 7.3 1,038.7 8.6
% of net sales ............... 69.04% 69.31% 68.95%
Gross profit ................ 6,306.1 5,802.5 5,435.7 503.6 8.7 366.8 6.7
% of net sales ............... 30.96% 30.69% 31.05%
Selling, general and administrative
expenses ................. 4,365.8 4,033.4 3,699.6 332.4 8.2 333.9 9.0
% of net sales ............... 21.43% 21.33% 21.14%
Operating profit ............. 1,940.3 1,769.1 1,736.2 171.2 9.7 32.9 1.9
% of net sales ............... 9.53% 9.36% 9.92%
Interest expense .............. 86.9 88.2 89.0 (1.3) (1.5) (0.8) (0.8)
% of net sales ............... 0.43% 0.47% 0.51%
Other (income) expense ........ 0.3 — 18.9 0.3 — (18.9) (100.0)
% of net sales ............... 0.00% 0.00% 0.11%
Income before income taxes ..... 1,853.0 1,680.9 1,628.3 172.2 10.2 52.5 3.2
% of net sales ............... 9.10% 8.89% 9.30%
Income taxes ................ 687.9 615.5 603.2 72.4 11.8 12.3 2.0
% of net sales ............... 3.38% 3.26% 3.45%
Net income ................. $1,165.1 $ 1,065.3 $ 1,025.1 $ 99.7 9.4% $ 40.2 3.9%
% of net sales ............... 5.72% 5.63% 5.86%
Diluted earnings per share ...... $ 3.95 $ 3.49 $ 3.17 $ 0.46 13.2% $ 0.32 10.1%
Net Sales. The net sales increase in 2015 reflects a same-store sales increase of 2.8% compared to
2014. For 2015, there were 11,706 same-stores which accounted for sales of $19.25 billion. Same-stores
include stores that have been open for at least 13 months and remain open at the end of the reporting
period. Changes in same-store sales are calculated based on the comparable calendar weeks in the
27