Dollar General 2015 Annual Report Download - page 145
Download and view the complete annual report
Please find page 145 of the 2015 Dollar General annual report below. You can navigate through the pages in the report by either clicking on the pages listed below, or by using the keyword search tool below to find specific information within the annual report.-
 1
1 -
2
-
3
-
4
-
5
-
6
-
7
-
8
-
9
-
10
-
11
-
12
-
13
-
14
-
15
-
16
-
17
-
18
-
19
-
20
-
21
-
22
-
23
-
24
-
25
-
26
-
27
-
28
-
29
-
30
-
31
-
32
-
33
-
34
-
35
-
36
-
37
-
38
-
39
-
40
-
41
-
42
-
43
-
44
-
45
-
46
-
47
-
48
-
49
-
50
-
51
-
52
-
53
-
54
-
55
-
56
-
57
-
58
-
59
-
60
-
61
-
62
-
63
-
64
-
65
-
66
-
67
-
68
-
69
-
70
-
71
-
72
-
73
-
74
-
75
-
76
-
77
-
78
-
79
-
80
-
81
-
82
-
83
-
84
-
85
-
86
-
87
-
88
-
89
-
90
-
91
-
92
-
93
-
94
-
95
-
96
-
97
-
98
-
99
-
100
-
101
-
102
-
103
-
104
-
105
-
106
-
107
-
108
-
109
-
110
-
111
-
112
-
113
-
114
-
115
-
116
-
117
-
118
-
119
-
120
-
121
-
122
-
123
-
124
-
125
-
126
-
127
-
128
-
129
-
130
-
131
-
132
-
133
-
134
-
 135
135 -
 136
136 -
 137
137 -
 138
138 -
 139
139 -
 140
140 -
 141
141 -
 142
142 -
 143
143 -
 144
144 -
 145
145 -
 146
146 -
 147
147 -
 148
148 -
 149
149 -
 150
150 -
 151
151 -
 152
152 -
 153
153 -
 154
154 -
 155
155 -
156
-
157
-
158
-
159
-
160
-
161
-
162
-
163
-
164
-
165
-
166
-
167
-
168
 |
 |

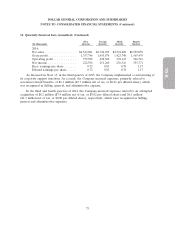
10-K
DOLLAR GENERAL CORPORATION AND SUBSIDIARIES
NOTES TO CONSOLIDATED FINANCIAL STATEMENTS (Continued)
10. Share-based payments (Continued)
Expected dividend yield—This is an estimate of the expected dividend yield on the Company’s
stock. An increase in the dividend yield will decrease compensation expense.
Expected stock price volatility—This is a measure of the amount by which the price of the
Company’s common stock has fluctuated or is expected to fluctuate. Since November 2011, the
expected volatilities for awards have been based on the historical volatility of the Company’s publicly
traded common stock. An increase in the expected volatility will increase compensation expense.
Weighted average risk-free interest rate—This is the U.S. Treasury rate for the week of the grant
having a term approximating the expected life of the option. An increase in the risk-free interest rate
will increase compensation expense.
Expected term of options—This is the period of time over which the options granted are expected
to remain outstanding. The Company has estimated the expected term as the mid-point between the
vesting date and the contractual term of the option. An increase in the expected term will increase
compensation expense.
A summary of the Company’s stock option activity, exclusive of options subject to an MSA, during
the year ended January 29, 2016 is as follows:
Average Remaining
Options Exercise Contractual Intrinsic
(Intrinsic value amounts reflected in thousands) Issued Price Term in Years Value
Balance, January 30, 2015 ........... 2,399,124 $49.69
Granted ....................... 1,247,557 74.73
Exercised ...................... (703,956) 45.66
Canceled ....................... (512,760) 61.67
Balance, January 29, 2016 ........... 2,429,965 $61.19 8.1 $33,701
Exercisable at January 29, 2016 ....... 517,375 $47.31 6.7 $14,355
The weighted average grant date fair value per share of non-MSA options granted was $18.48,
$17.26 and $13.86 during 2015, 2014 and 2013, respectively. The intrinsic value of non-MSA options
exercised during 2015, 2014, and 2013 was $20.8 million, $2.5 million and $0.8 million, respectively.
The number of performance share unit awards earned is based upon the Company’s annual
financial performance in the year of grant as specified in the award agreement. A summary of
performance share unit award activity during the year ended January 29, 2016 is as follows:
Units Intrinsic
(Intrinsic value amounts reflected in thousands) Issued Value
Balance, January 30, 2015 ............................ 212,583
Granted ......................................... 103,666
Converted to common stock .......................... (120,417)
Canceled ........................................ (51,735)
Balance, January 29, 2016 ............................ 144,097 $10,816
71