Dollar General 2015 Annual Report Download - page 49
Download and view the complete annual report
Please find page 49 of the 2015 Dollar General annual report below. You can navigate through the pages in the report by either clicking on the pages listed below, or by using the keyword search tool below to find specific information within the annual report.-
 1
1 -
2
-
3
-
4
-
5
-
6
-
7
-
8
-
9
-
10
-
11
-
12
-
13
-
14
-
15
-
16
-
17
-
18
-
19
-
20
-
21
-
22
-
23
-
24
-
25
-
26
-
27
-
28
-
29
-
30
-
31
-
32
-
33
-
34
-
35
-
36
-
37
-
38
-
 39
39 -
 40
40 -
 41
41 -
 42
42 -
 43
43 -
 44
44 -
 45
45 -
 46
46 -
 47
47 -
 48
48 -
 49
49 -
 50
50 -
 51
51 -
 52
52 -
 53
53 -
 54
54 -
 55
55 -
 56
56 -
 57
57 -
 58
58 -
 59
59 -
60
-
61
-
62
-
63
-
64
-
65
-
66
-
67
-
68
-
69
-
70
-
71
-
72
-
73
-
74
-
75
-
76
-
77
-
78
-
79
-
80
-
81
-
82
-
83
-
84
-
85
-
86
-
87
-
88
-
89
-
90
-
91
-
92
-
93
-
94
-
95
-
96
-
97
-
98
-
99
-
100
-
101
-
102
-
103
-
104
-
105
-
106
-
107
-
108
-
109
-
110
-
111
-
112
-
113
-
114
-
115
-
116
-
117
-
118
-
119
-
120
-
121
-
122
-
123
-
124
-
125
-
126
-
127
-
128
-
129
-
130
-
131
-
132
-
133
-
134
-
135
-
136
-
137
-
138
-
139
-
140
-
141
-
142
-
143
-
144
-
145
-
146
-
147
-
148
-
149
-
150
-
151
-
152
-
153
-
154
-
155
-
156
-
157
-
158
-
159
-
160
-
161
-
162
-
163
-
164
-
165
-
166
-
167
-
168
 |
 |

Proxy
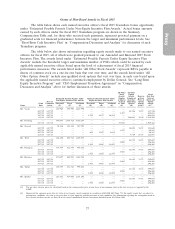
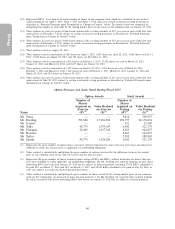
Grants of Plan-Based Awards in Fiscal 2015
The table below shows each named executive officer’s fiscal 2015 Teamshare bonus opportunity
under ‘‘Estimated Possible Payouts Under Non-Equity Incentive Plan Awards.’’ Actual bonus amounts
earned by such officers under the fiscal 2015 Teamshare program are shown in the Summary
Compensation Table and, for those who received such payments, represent prorated payment on a
graduated scale for financial performance between the target and maximum performance levels. See
‘‘Short-Term Cash Incentive Plan’’ in ‘‘Compensation Discussion and Analysis’’ for discussion of such
Teamshare program.
The table below also shows information regarding equity awards made to our named executive
officers for fiscal 2015, all of which were granted pursuant to our Amended and Restated 2007 Stock
Incentive Plan. The awards listed under ‘‘Estimated Possible Payouts Under Equity Incentive Plan
Awards’’ include the threshold, target and maximum number of PSUs which could be earned by each
applicable named executive officer based upon the level of achievement of fiscal 2015 financial
performance measures. The awards listed under ‘‘All Other Stock Awards’’ represent RSUs payable in
shares of common stock on a one-for-one basis that vest over time, and the awards listed under ‘‘All
Other Option Awards’’ include non-qualified stock options that vest over time, in each case based upon
the applicable named executive officer’s continued employment by Dollar General. See ‘‘Long-Term
Equity Incentive Program’’ and ‘‘CEO Employment Transition Agreement’’ in ‘‘Compensation
Discussion and Analysis’’ above for further discussion of these awards.
All Other All Other
Stock Option Grant
Awards: Awards: Exercise Date Fair
Number Number of or Base Value of
Estimated Possible Payouts Under Estimated Possible Payouts Under of Shares Securities Price of Stock and
Non-Equity Incentive Plan Awards Equity Incentive Plan Awards
Date of of Stock Underlying Option Option
Grant Committee Threshold Target Maximum Threshold Target Maximum or Units Options Awards Awards
Name Date Action ($) ($) ($) (#) (#) (#) (#) (#) ($/Sh)(1) ($)(2)
Mr. Vasos — — 437,965 875,930 2,627,790 — — — — — — —
3/17/15 3/17/15 — — — — — — — 44,786 74.72 817,716
3/17/15 3/17/15 — — — — — — 5,407 — — 404,011
3/17/15 3/17/15 — — — 2,704 5,407 16,221 — — — 404,011
6/3/15 5/27/15 — — — — — — — 256,682 76.00 5,114,569
Mr. Dreiling — — 889,357 1,778,715 5,336,144 — — — — — — —
3/17/15 3/17/15 — — — — — — 57,670 — — 4,309,102
Mr. Garratt — — 91,216 182,433 547,298 — — — — — — —
3/17/15 3/17/15 — — — — — — — 10,002 74.72 182,620
3/17/15 3/17/15 — — — — — — 1,207 — — 90,187
3/17/15 3/17/15 — — — 604 1,207 3,621 — — — 90,187
12/2/15 12/1/15 — — — — — — — 7,829 65.35 121,075
Mr. Tehle — — 244,256 488,513 1,465,538 — — — — — — —
3/17/15 3/17/15 — — — — — — — 32,843 74.72 599,657
3/17/15 3/17/15 — — — — — — 3,965 — — 296,265
3/17/15 3/17/15 — — — 1,983 3,965 11,895 — — — 296,265
Mr. Flanigan — — 155,874 311,747 935,241 — — — — — — —
3/17/15 3/17/15 — — — — — — — 32,843 74.72 599,657
3/17/15 3/17/15 — — — — — — 3,965 — — 296,265
3/17/15 3/17/15 — — — 1,983 3,965 11,895 — — — 296,265
Mr. Ravener — — 170,457 340,915 1,022,744 — — — — — — —
3/17/15 3/17/15 — — — — — — — 32,843 74.72 599,657
3/17/15 3/17/15 — — — — — — 3,965 — — 296,265
3/17/15 3/17/15 — — — 1,983 3,965 11,895 — — — 296,265
Ms. Taylor — — 165,757 331,514 994,543 — — — — — — —
3/17/15 3/17/15 — — — — — — — 32,843 74.72 599,657
3/17/15 3/17/15 — — — — — — 3,965 — — 296,265
3/17/15 3/17/15 — — — 1,983 3,965 11,895 — — — 296,265
Mr. Sparks — — 213,532 427,064 1,281,193 — — — — — — —
3/17/15 3/17/15 — — — — — — — 32,843 74.72 599,657
3/17/15 3/17/15 — — — — — — 3,965 — — 296,265
3/17/15 3/17/15 — — — 1,983 3,965 11,895 — — — 296,265
(1) The per share exercise price was calculated based on the closing market price of one share of our common stock on the date of grant as reported by the
NYSE.
(2) Represents the aggregate grant date fair value of each equity award, computed in accordance with FASB ASC Topic 718. For equity awards that are subject to
performance conditions, the value at the grant date is based upon the probable outcome of such conditions. For information regarding the assumptions made in
the valuation of these awards, see Note 10 of the annual consolidated financial statements included in our 2015 Form 10-K.
37