Dollar General 2015 Annual Report Download - page 119
Download and view the complete annual report
Please find page 119 of the 2015 Dollar General annual report below. You can navigate through the pages in the report by either clicking on the pages listed below, or by using the keyword search tool below to find specific information within the annual report.
10-K
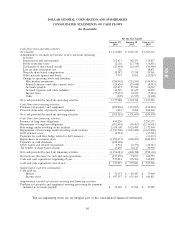
DOLLAR GENERAL CORPORATION AND SUBSIDIARIES
CONSOLIDATED STATEMENTS OF CASH FLOWS
(In thousands)
For the Year Ended
January 29, January 30, January 31,
2016 2015 2014
Cash flows from operating activities:
Net income .......................................... $1,165,080 $ 1,065,345 $ 1,025,116
Adjustments to reconcile net income to net cash from operating
activities:
Depreciation and amortization ........................... 352,431 342,353 332,837
Deferred income taxes ................................. 12,126 (17,734) (36,851)
Tax benefit of share-based awards ......................... (13,698) (12,147) (30,990)
Loss on debt retirement, net ............................. 326 — 18,871
Noncash share-based compensation ........................ 38,547 37,338 20,961
Other noncash (gains) and losses .......................... 7,797 8,551 (12,747)
Change in operating assets and liabilities:
Merchandise inventories .............................. (290,001) (233,559) (144,943)
Prepaid expenses and other current assets .................. (24,626) (25,048) (4,947)
Accounts payable ................................... 105,637 97,166 36,942
Accrued expenses and other liabilities ..................... 44,949 41,635 16,265
Income taxes ...................................... (19,675) 12,399 (5,249)
Other ........................................... (905) (1,555) (2,200)
Net cash provided by (used in) operating activities ............... 1,377,988 1,314,744 1,213,065
Cash flows from investing activities:
Purchases of property and equipment ........................ (504,806) (373,967) (538,444)
Proceeds from sales of property and equipment ................. 1,423 2,268 288,466
Net cash provided by (used in) investing activities ................ (503,383) (371,699) (249,978)
Cash flows from financing activities:
Issuance of long-term obligations ........................... 499,220 — 2,297,177
Repayments of long-term obligations ......................... (502,401) (78,467) (2,119,991)
Borrowings under revolving credit facilities ..................... 2,034,100 1,023,000 1,172,900
Repayments of borrowings under revolving credit facilities .......... (1,783,100) (1,023,000) (1,303,800)
Debt issuance costs ..................................... (6,991) — (15,996)
Payments for cash flow hedge related to debt issuance ............. — — (13,217)
Repurchases of common stock ............................. (1,299,613) (800,095) (620,052)
Payments of cash dividends ............................... (258,328) — —
Other equity and related transactions ........................ 6,934 (2,373) (26,341)
Tax benefit of share-based awards ........................... 13,698 12,147 30,990
Net cash provided by (used in) financing activities ................ (1,296,481) (868,788) (598,330)
Net increase (decrease) in cash and cash equivalents .............. (421,876) 74,257 364,757
Cash and cash equivalents, beginning of year ................... 579,823 505,566 140,809
Cash and cash equivalents, end of year ....................... $ 157,947 $ 579,823 $ 505,566
Supplemental cash flow information:
Cash paid for:
Interest .......................................... $ 76,354 $ 82,447 $ 73,464
Income taxes ...................................... $ 697,357 $ 631,483 $ 646,811
Supplemental schedule of noncash investing and financing activities:
Purchases of property and equipment awaiting processing for payment,
included in Accounts payable ............................ $ 32,020 $ 31,586 $ 27,082
The accompanying notes are an integral part of the consolidated financial statements.
45


