Dollar General 2015 Annual Report Download - page 41
Download and view the complete annual report
Please find page 41 of the 2015 Dollar General annual report below. You can navigate through the pages in the report by either clicking on the pages listed below, or by using the keyword search tool below to find specific information within the annual report.-
 1
1 -
2
-
3
-
4
-
5
-
6
-
7
-
8
-
9
-
10
-
11
-
12
-
13
-
14
-
15
-
16
-
17
-
18
-
19
-
20
-
21
-
22
-
23
-
24
-
25
-
26
-
27
-
28
-
29
-
30
-
 31
31 -
 32
32 -
 33
33 -
 34
34 -
 35
35 -
 36
36 -
 37
37 -
 38
38 -
 39
39 -
 40
40 -
 41
41 -
 42
42 -
 43
43 -
 44
44 -
 45
45 -
 46
46 -
 47
47 -
 48
48 -
 49
49 -
 50
50 -
 51
51 -
52
-
53
-
54
-
55
-
56
-
57
-
58
-
59
-
60
-
61
-
62
-
63
-
64
-
65
-
66
-
67
-
68
-
69
-
70
-
71
-
72
-
73
-
74
-
75
-
76
-
77
-
78
-
79
-
80
-
81
-
82
-
83
-
84
-
85
-
86
-
87
-
88
-
89
-
90
-
91
-
92
-
93
-
94
-
95
-
96
-
97
-
98
-
99
-
100
-
101
-
102
-
103
-
104
-
105
-
106
-
107
-
108
-
109
-
110
-
111
-
112
-
113
-
114
-
115
-
116
-
117
-
118
-
119
-
120
-
121
-
122
-
123
-
124
-
125
-
126
-
127
-
128
-
129
-
130
-
131
-
132
-
133
-
134
-
135
-
136
-
137
-
138
-
139
-
140
-
141
-
142
-
143
-
144
-
145
-
146
-
147
-
148
-
149
-
150
-
151
-
152
-
153
-
154
-
155
-
156
-
157
-
158
-
159
-
160
-
161
-
162
-
163
-
164
-
165
-
166
-
167
-
168
 |
 |

Proxy
aligned with the equity mix among our market comparator group and balanced the incentive and
retention goals of these awards.
The options are granted with a per share exercise price equal to the fair market value of one
share of our common stock on the grant date. The options vest 25% annually on the April 1 of each of
the four fiscal years following the fiscal year in which the grant is made, subject to the named executive
officer’s continued employment with us and certain accelerated vesting provisions. The RSUs are
payable in shares of our common stock and vest 331⁄3% over three years on the April 1 of the three
fiscal years following the fiscal year in which the grant is made, subject to continued employment with
us and certain accelerated vesting conditions. The PSUs can be earned if specified performance goals
are achieved during the performance period (which was fiscal year 2015) and if certain additional
vesting requirements are met.
For PSUs the Committee selects and sets targets for financial performance measures, then
establishes threshold and maximum levels of performance derived from those targets. The number of
PSUs earned depends on the level of financial performance achieved versus the goals. The Committee
selected adjusted EBITDA (weighted 50%) and ROIC (weighted 50%) as the 2015 financial
performance measures for the PSUs at target levels equal to those used in our 2015 financial plan.
These financial measures and weightings have been used for the PSUs since 2013 to appropriately
balance the emphasis placed upon earnings performance as well as rigorous capital management over
the long-term.
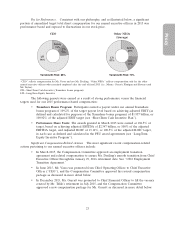
The adjusted EBITDA performance target is computed as income (loss) from continuing
operations before cumulative effect of change in accounting principles plus interest and other financing
costs, net, provision for income taxes, and depreciation and amortization, but excludes the impact of all
items excluded from the 2015 Teamshare program adjusted EBIT calculation outlined above, as well as
share-based compensation charges. The ROIC performance target is calculated as (a) the result of
(x) the sum of (i) our operating income, plus (ii) depreciation and amortization, plus (iii) minimum
rentals, minus (y) taxes, divided by (b) the result of (x) the sum of the averages of: (i) total assets, plus
(ii) accumulated depreciation and amortization, minus (y) (i) cash, minus (ii) goodwill, minus
(iii) accounts payable, minus (iv) other payables, minus (v) accrued liabilities, plus (vi) 8x minimum
rentals but excludes the impact of all items excluded from the 2015 Teamshare program adjusted EBIT
calculation outlined above.
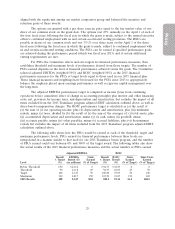
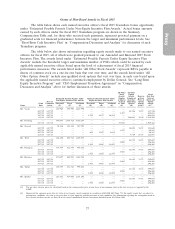
The following table shows how the PSUs would be earned at each of the threshold, target and
maximum performance levels. PSUs earned for financial performance between these levels are
interpolated in a manner similar to that used for our 2015 Teamshare bonus program, and the number
of PSUs earned could vary between 0% and 300% of the target award. The following tables also show
the actual results of the 2015 financial performance measures and the actual number of PSUs earned.
Adjusted EBITDA ROIC
Result EBITDA Units Result ROIC Units Total Units
v. Target Result ($) Earned v. Target Result Earned Earned
Level (%) (in millions) (% of Target) (%) (%) (% of Target) (% of Target)
Below Threshold <90 <2,112 0 <94.75 <18.05 0 0
Threshold 90 2,112 25 94.75 18.05 25 50
Target 100 2,347 50 100.00 19.05 50 100
Maximum 120 2,817 150 110.50 21.05 150 300
2015 Results 100 2,347 50.0 100.5 19.14 54.5 104.5
29