Dollar General 2010 Annual Report Download - page 86
Download and view the complete annual report
Please find page 86 of the 2010 Dollar General annual report below. You can navigate through the pages in the report by either clicking on the pages listed below, or by using the keyword search tool below to find specific information within the annual report.-
 1
1 -
2
-
3
-
4
-
5
-
6
-
7
-
8
-
9
-
10
-
11
-
12
-
13
-
14
-
15
-
16
-
17
-
18
-
19
-
20
-
21
-
22
-
23
-
24
-
25
-
26
-
27
-
28
-
29
-
30
-
31
-
32
-
33
-
34
-
35
-
36
-
37
-
38
-
39
-
40
-
41
-
42
-
43
-
44
-
45
-
46
-
47
-
48
-
49
-
50
-
51
-
52
-
53
-
54
-
55
-
56
-
57
-
58
-
59
-
60
-
61
-
62
-
63
-
64
-
65
-
66
-
67
-
68
-
69
-
70
-
71
-
72
-
73
-
74
-
75
-
 76
76 -
 77
77 -
 78
78 -
 79
79 -
 80
80 -
 81
81 -
 82
82 -
 83
83 -
 84
84 -
 85
85 -
 86
86 -
 87
87 -
 88
88 -
 89
89 -
 90
90 -
 91
91 -
 92
92 -
 93
93 -
 94
94 -
 95
95 -
 96
96 -
97
-
98
-
99
-
100
-
101
-
102
-
103
-
104
-
105
-
106
-
107
-
108
-
109
-
110
-
111
-
112
-
113
-
114
-
115
-
116
-
117
-
118
-
119
-
120
-
121
-
122
-
123
-
124
-
125
-
126
-
127
-
128
-
129
-
130
-
131
-
132
-
133
-
134
-
135
-
136
-
137
-
138
-
139
-
140
-
141
-
142
-
143
-
144
-
145
-
146
-
147
-
148
-
149
-
150
-
151
-
152
-
153
-
154
-
155
-
156
-
157
-
158
-
159
-
160
-
161
-
162
-
163
-
164
-
165
-
166
-
167
-
168
-
169
-
170
-
171
-
172
-
173
-
174
-
175
-
176
-
177
-
178
-
179
-
180
-
181
-
182
-
183
-
184
-
185
-
186
-
187
-
188
-
189
-
190
-
191
-
192
-
193
-
194
-
195
-
196
 |
 |

10-K
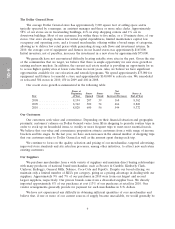
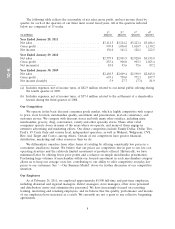
The following table reflects the seasonality of net sales, gross profit, and net income (loss) by
quarter for each of the quarters of our three most recent fiscal years. All of the quarters reflected
below are comprised of 13 weeks.
1st 2nd 3rd 4th
(in millions) Quarter Quarter Quarter Quarter
Year Ended January 28, 2011
Net sales ...................................... $3,111.3 $3,214.2 $3,223.4 $3,486.1
Gross profit .................................... 999.8 1,036.0 1,010.7 1,130.2
Net income .................................... 136.0 141.2 128.1 222.5
Year Ended January 29, 2010
Net sales ...................................... $2,779.9 $2,901.9 $2,928.8 $3,185.8
Gross profit .................................... 855.4 906.0 903.1 1,025.4
Net income(a) .................................. 83.0 93.6 75.6 87.2
Year Ended January 30, 2009
Net sales ...................................... $2,403.5 $2,609.4 $2,598.9 $2,845.8
Gross profit .................................... 693.1 758.0 772.3 837.7
Net income (loss)(b) ............................. 5.9 27.7 (7.3) 81.9
(a) Includes expenses, net of income taxes, of $82.9 million related to our initial public offering during
the fourth quarter of 2009.
(b) Includes expenses, net of income taxes, of $37.4 million related to the settlement of a shareholder
lawsuit during the third quarter of 2008.
Our Competition
We operate in the basic discount consumer goods market, which is highly competitive with respect
to price, store location, merchandise quality, assortment and presentation, in-stock consistency, and
customer service. We compete with discount stores and with many other retailers, including mass
merchandise, grocery, drug, convenience, variety and other specialty stores. These other retail
companies operate stores in many of the areas where we operate, and many of them engage in
extensive advertising and marketing efforts. Our direct competitors include Family Dollar, Dollar Tree,
Fred’s, 99 Cents Only and various local, independent operators, as well as Walmart, Walgreens, CVS,
Rite Aid, Target and Costco, among others. Certain of our competitors have greater financial,
distribution, marketing and other resources than we do.
We differentiate ourselves from other forms of retailing by offering consistently low prices in a
convenient, small-store format. We believe that our prices are competitive due in part to our low cost
operating structure and the relatively limited assortment of products offered. Historically, we have
minimized labor by offering fewer price points and a reliance on simple merchandise presentation.
Purchasing large volumes of merchandise within our focused assortment in each merchandise category
allows us to keep our average costs low, contributing to our ability to offer competitive everyday low
prices to our customers. See ‘‘—Our Business Model’’ above for further discussion of our competitive
situation.
Our Employees
As of February 25, 2011, we employed approximately 85,900 full-time and part-time employees,
including divisional and regional managers, district managers, store managers, other store personnel
and distribution center and administrative personnel. We have increasingly focused on recruiting,
training, motivating and retaining employees, and we believe that the quality, performance and morale
of our employees have increased as a result. We currently are not a party to any collective bargaining
agreements.
8