Dollar General 2010 Annual Report Download - page 112
Download and view the complete annual report
Please find page 112 of the 2010 Dollar General annual report below. You can navigate through the pages in the report by either clicking on the pages listed below, or by using the keyword search tool below to find specific information within the annual report.-
 1
1 -
2
-
3
-
4
-
5
-
6
-
7
-
8
-
9
-
10
-
11
-
12
-
13
-
14
-
15
-
16
-
17
-
18
-
19
-
20
-
21
-
22
-
23
-
24
-
25
-
26
-
27
-
28
-
29
-
30
-
31
-
32
-
33
-
34
-
35
-
36
-
37
-
38
-
39
-
40
-
41
-
42
-
43
-
44
-
45
-
46
-
47
-
48
-
49
-
50
-
51
-
52
-
53
-
54
-
55
-
56
-
57
-
58
-
59
-
60
-
61
-
62
-
63
-
64
-
65
-
66
-
67
-
68
-
69
-
70
-
71
-
72
-
73
-
74
-
75
-
76
-
77
-
78
-
79
-
80
-
81
-
82
-
83
-
84
-
85
-
86
-
87
-
88
-
89
-
90
-
91
-
92
-
93
-
94
-
95
-
96
-
97
-
98
-
99
-
100
-
101
-
 102
102 -
 103
103 -
 104
104 -
 105
105 -
 106
106 -
 107
107 -
 108
108 -
 109
109 -
 110
110 -
 111
111 -
 112
112 -
 113
113 -
 114
114 -
 115
115 -
 116
116 -
 117
117 -
 118
118 -
 119
119 -
 120
120 -
 121
121 -
 122
122 -
123
-
124
-
125
-
126
-
127
-
128
-
129
-
130
-
131
-
132
-
133
-
134
-
135
-
136
-
137
-
138
-
139
-
140
-
141
-
142
-
143
-
144
-
145
-
146
-
147
-
148
-
149
-
150
-
151
-
152
-
153
-
154
-
155
-
156
-
157
-
158
-
159
-
160
-
161
-
162
-
163
-
164
-
165
-
166
-
167
-
168
-
169
-
170
-
171
-
172
-
173
-
174
-
175
-
176
-
177
-
178
-
179
-
180
-
181
-
182
-
183
-
184
-
185
-
186
-
187
-
188
-
189
-
190
-
191
-
192
-
193
-
194
-
195
-
196
 |
 |

10-K
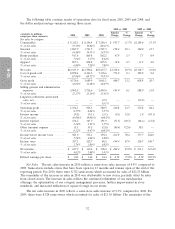
initiatives. Other costs increasing at a rate lower than our 10.5% increase in sales include utilities,
which reflect lower waste management costs resulting from our recycling efforts, as well as repairs and
maintenance. Our increased sales levels in 2010 also favorably impacted SG&A, as a percentage of
sales. Debit card fees increased at a higher rate than the increase in sales, primarily as a result of
increased usage.
SG&A, as a percentage of sales, was 23.2% in 2009 compared to 23.4% in 2008, representing an
improvement of 21 basis points before taking into account the impact of our initial public offering as
discussed above. Our increased sales levels in 2009 favorably impacted SG&A, as a percentage of sales,
with the most significant impact on store occupancy costs, including rent and utilities. Our cost of
utilities, as a percentage of sales, was further reduced by energy savings resulting from our store energy
management initiatives, including forward purchase contracts, increased preventive maintenance and
the installation of energy management systems in substantially all of our new and relocated stores. In
addition, we continued to significantly reduce our workers’ compensation expense through safety
initiatives implemented over the last several years, and legal expenses were lower in 2009 than 2008,
which included expenses incurred in connection with a shareholder litigation settlement in 2008 relating
to our 2007 merger. Also during 2008, we recorded a $5.0 million gain relating to potential losses on
distribution center leases indirectly related to our 2007 merger.
Litigation Settlement and Related Costs, Net. Expenses in 2008 included $32.0 million which
represents the settlement of a class action lawsuit filed in response to our 2007 merger, and includes a
$40.0 million settlement plus related expenses of $2.0 million, net of $10.0 million of insurance
proceeds received in the fourth quarter of 2008.
Interest Expense. The decrease in interest expense in 2010 compared to 2009 was primarily the
result of lower average outstanding long-term obligations. The decrease in interest expense in 2009
compared to 2008 was primarily the result of lower average outstanding long-term obligations and
lower interest rates on our term loan.
We had outstanding variable-rate debt of $931 million and $560 million as of January 28, 2011 and
January 29, 2010, respectively, after taking into consideration the impact of interest rate swaps. The
remainder of our outstanding indebtedness at January 28, 2011 and January 29, 2010 was fixed rate
debt.
See the detailed discussion under ‘‘Liquidity and Capital Resources’’ regarding indebtedness
incurred to finance our 2007 merger along with subsequent repurchases of various long-term obligations
and the related effect on interest expense in the periods presented.
Other (Income) Expense. In 2010, we recorded pretax losses of $14.7 million resulting from the
repurchase in the open market of $115.0 million aggregate principal amount of our Senior Notes plus
accrued and unpaid interest.
In 2009, we recorded charges totaling $55.5 million, which primarily represents losses on debt
retirement totaling $55.3 million, and also includes expense of $0.6 million related to hedge
ineffectiveness on certain of our interest rate swaps.
In 2008, we recorded a gain of $3.8 million resulting from the repurchase of $44.1 million of our
senior subordinated notes, offset by expense of $1.0 million related to hedge ineffectiveness on certain
of our interest rate swaps.
Income Taxes. The effective income tax rates for 2010, 2009 and 2008 were expenses of 36.3%,
38.5%, and 44.4%, respectively.
34