Dollar General 2010 Annual Report Download - page 40
Download and view the complete annual report
Please find page 40 of the 2010 Dollar General annual report below. You can navigate through the pages in the report by either clicking on the pages listed below, or by using the keyword search tool below to find specific information within the annual report.-
 1
1 -
2
-
3
-
4
-
5
-
6
-
7
-
8
-
9
-
10
-
11
-
12
-
13
-
14
-
15
-
16
-
17
-
18
-
19
-
20
-
21
-
22
-
23
-
24
-
25
-
26
-
27
-
28
-
29
-
 30
30 -
 31
31 -
 32
32 -
 33
33 -
 34
34 -
 35
35 -
 36
36 -
 37
37 -
 38
38 -
 39
39 -
 40
40 -
 41
41 -
 42
42 -
 43
43 -
 44
44 -
 45
45 -
 46
46 -
 47
47 -
 48
48 -
 49
49 -
 50
50 -
51
-
52
-
53
-
54
-
55
-
56
-
57
-
58
-
59
-
60
-
61
-
62
-
63
-
64
-
65
-
66
-
67
-
68
-
69
-
70
-
71
-
72
-
73
-
74
-
75
-
76
-
77
-
78
-
79
-
80
-
81
-
82
-
83
-
84
-
85
-
86
-
87
-
88
-
89
-
90
-
91
-
92
-
93
-
94
-
95
-
96
-
97
-
98
-
99
-
100
-
101
-
102
-
103
-
104
-
105
-
106
-
107
-
108
-
109
-
110
-
111
-
112
-
113
-
114
-
115
-
116
-
117
-
118
-
119
-
120
-
121
-
122
-
123
-
124
-
125
-
126
-
127
-
128
-
129
-
130
-
131
-
132
-
133
-
134
-
135
-
136
-
137
-
138
-
139
-
140
-
141
-
142
-
143
-
144
-
145
-
146
-
147
-
148
-
149
-
150
-
151
-
152
-
153
-
154
-
155
-
156
-
157
-
158
-
159
-
160
-
161
-
162
-
163
-
164
-
165
-
166
-
167
-
168
-
169
-
170
-
171
-
172
-
173
-
174
-
175
-
176
-
177
-
178
-
179
-
180
-
181
-
182
-
183
-
184
-
185
-
186
-
187
-
188
-
189
-
190
-
191
-
192
-
193
-
194
-
195
-
196
 |
 |

Proxy
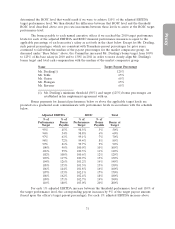
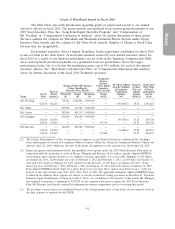
110% of the target performance level, the corresponding payout increases by 10.24% of the target
payout amount (based upon the officer’s target payout percentage). For ROIC, each 0.67% increase in
performance between the threshold performance level and the target performance level increases the
payout percentage by 1%. For each 0.67% increase in ROIC performance above the target
performance level, the bonus payout increases by 1%, and above 200% of the target payout level, the
bonus payout increases by 1.14%. Payout percentages greater than 200% of the target payout levels are
based on an approximate sharing between Dollar General (80%) and the Teamshare participants (20%)
of the incremental adjusted EBITDA dollars earned above the 110% of the adjusted EBITDA
performance level, split 90% to adjusted EBITDA and 10% to ROIC.
This proration schedule, through 110% of the target performance level, is consistent with the
schedule approved by the Committee in 2007 in reliance upon benchmarking data which, at that time,
indicated that the typical practice was to set the threshold payout percentage at half of the target and
the maximum payout percentage at twice the target. The Committee determined in 2008 that the
proration schedule for adjusted EBITDA performance above 110% of target should approximate a
sharing between Dollar General (80%) and the Teamshare participants (20%) of the adjusted EBITDA
dollars earned above that level.
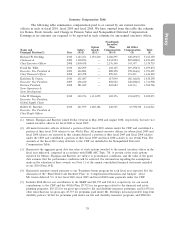
(b) 2010 Teamshare Results. The Committee approved the adjusted EBITDA/ROIC
performance results at 105.5% and 100.9% of target, respectively, which equate to a payout of 152.24%
of individual bonus targets under the 2010 Teamshare program. Accordingly, a 2010 Teamshare payout
was made to each named executive officer at the following percentages of base salary earned:
Mr. Dreiling, 190.30%; and each of Mr. Tehle, Ms. Guion, Mr. Flanigan and Mr. Ravener, 98.96%.
Such amounts are reflected in the ‘‘Non-Equity Incentive Plan Compensation’’ column of the Summary
Compensation Table.
(c) 2011 Teamshare Structure. The Committee has approved a 2011 Teamshare structure
similar to that which was approved for 2010. The Committee approved certain changes to the items
that are to be excluded from the calculation of the ROIC performance measure and made adjustments
to the graduated scale of payouts pertaining to ROIC. All of these changes will be discussed in detail
in our proxy statement for the 2012 annual meeting.
The applicable percentage of each named executive officer’s salary upon which his or her
bonus is based for the 2011 Teamshare plan is also the same as in 2010, except for Mr. Dreiling whose
target, as discussed above, was increased to 130% of base salary. Those percentages continue to
approximate the median of the payout percentages for the market comparator group.
Long-Term Equity Incentive Program. Long-term equity incentives motivate named executive
officers to focus on long-term success for shareholders. These incentives help provide a balanced focus
on both short-term and long-term goals and are also important to our compensation program’s
recruiting and retention objectives because most of the companies in our market comparator group
offer them. Our long-term equity incentives are designed to compensate named executive officers for a
long-term commitment to us, while motivating sustained increases in our financial performance and
shareholder value. We believe that our long-term equity incentive program provides significant
motivation and retention value to us for many reasons, most notably:
• Due to limitations on transferability for most of the equity awards under the program until
the earlier to occur of the fifth anniversary of certain specified dates or certain liquidity
events, a significant portion of the investment in our common stock generally is illiquid while
the executive remains employed by us. If an executive’s employment with us terminates, we
may generally compel him or her to sell that stock back to us for a price determined in
accordance with the Management Stockholder’s Agreement between us and that executive.
32