Dollar General 2010 Annual Report Download - page 121
Download and view the complete annual report
Please find page 121 of the 2010 Dollar General annual report below. You can navigate through the pages in the report by either clicking on the pages listed below, or by using the keyword search tool below to find specific information within the annual report.-
 1
1 -
2
-
3
-
4
-
5
-
6
-
7
-
8
-
9
-
10
-
11
-
12
-
13
-
14
-
15
-
16
-
17
-
18
-
19
-
20
-
21
-
22
-
23
-
24
-
25
-
26
-
27
-
28
-
29
-
30
-
31
-
32
-
33
-
34
-
35
-
36
-
37
-
38
-
39
-
40
-
41
-
42
-
43
-
44
-
45
-
46
-
47
-
48
-
49
-
50
-
51
-
52
-
53
-
54
-
55
-
56
-
57
-
58
-
59
-
60
-
61
-
62
-
63
-
64
-
65
-
66
-
67
-
68
-
69
-
70
-
71
-
72
-
73
-
74
-
75
-
76
-
77
-
78
-
79
-
80
-
81
-
82
-
83
-
84
-
85
-
86
-
87
-
88
-
89
-
90
-
91
-
92
-
93
-
94
-
95
-
96
-
97
-
98
-
99
-
100
-
101
-
102
-
103
-
104
-
105
-
106
-
107
-
108
-
109
-
110
-
 111
111 -
 112
112 -
 113
113 -
 114
114 -
 115
115 -
 116
116 -
 117
117 -
 118
118 -
 119
119 -
 120
120 -
 121
121 -
 122
122 -
 123
123 -
 124
124 -
 125
125 -
 126
126 -
 127
127 -
 128
128 -
 129
129 -
 130
130 -
 131
131 -
132
-
133
-
134
-
135
-
136
-
137
-
138
-
139
-
140
-
141
-
142
-
143
-
144
-
145
-
146
-
147
-
148
-
149
-
150
-
151
-
152
-
153
-
154
-
155
-
156
-
157
-
158
-
159
-
160
-
161
-
162
-
163
-
164
-
165
-
166
-
167
-
168
-
169
-
170
-
171
-
172
-
173
-
174
-
175
-
176
-
177
-
178
-
179
-
180
-
181
-
182
-
183
-
184
-
185
-
186
-
187
-
188
-
189
-
190
-
191
-
192
-
193
-
194
-
195
-
196
 |
 |

10-K
Other Considerations
We have no current plans to pay any cash dividends on our common stock and instead may retain
earnings, if any, for future operation and expansion and debt repayment. Any decision to declare and
pay dividends in the future will be made at the discretion of our Board of Directors, subject to certain
limitations found in covenants in our Credit Facilities and in the indentures governing the Notes as
discussed in more detail above, and will depend on, among other things, our results of operations, cash
requirements, financial condition, contractual restrictions and other factors that our Board of Directors
may deem relevant.
Our inventory balance represented approximately 45% of our total assets exclusive of goodwill and
other intangible assets as of January 28, 2011. Our proficiency in managing our inventory balances can
have a significant impact on our cash flows from operations during a given fiscal year. As a result,
efficient inventory management has been and continues to be an area of focus for us.
As described in Note 9 to the Consolidated Financial Statements, we are involved in a number of
legal actions and claims, some of which could potentially result in material cash payments. Adverse
developments in those actions could materially and adversely affect our liquidity. As discussed in
Note 6 to the Consolidated Financial Statements, we also have certain income tax-related
contingencies. Future negative developments could have a material adverse effect on our liquidity.
In June 2010, Standard & Poor’s upgraded our long-term debt rating to BB from BB- with a stable
outlook and in November 2010, Moody’s upgraded our long-term debt rating to Ba3 from B1 with a
positive outlook. These current ratings are considered non-investment grade. Our current credit ratings,
as well as future rating agency actions, could (i) impact our ability to obtain financings to finance our
operations on satisfactory terms; (ii) affect our financing costs; and (iii) affect our insurance premiums
and collateral requirements necessary for our self-insured programs.
Cash flows
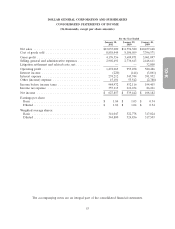
Cash flows from operating activities. A significant component of our increase in cash flows from
operating activities in 2010 compared to 2009 was the increase in net income due to greater sales,
higher gross margins and lower SG&A expenses as a percentage of sales, as described in more detail
above under ‘‘Results of Operations.’’ Partially offsetting this increase in cash flows were changes in
inventory balances, which increased by 16% in 2010 compared to an increase of 7% in 2009. Although
we continue to closely monitor our inventory balances, they often fluctuate from period to period and
from year to year based on new store openings, the timing of purchases, merchandising initiatives and
other factors. Inventory levels in the consumables category increased by $133.9 million, or 16%, in 2010
compared to an increase of $111.4 million, or 15%, in 2009. The seasonal category increased by
$55.2 million, or 18%, in 2010 compared to an increase of $25.3 million, or 9%, in 2009. The home
products category increased $25.2 million, or 17%, in 2010 compared to a decline of $9.1 million, or
6%, in 2009. The apparel category increased by $32.3 million, or 15%, in 2010 compared to a decline
of $22.9 million, or 10%, in 2009. In addition, increased net income resulted in an increase in income
taxes paid in 2010 compared to 2009. Changes in Accrued expenses and other were affected in part by
reductions of income tax reserves and reduced accruals for incentive compensation, partially offset by
the timing of payments related to a litigation settlement in prior years (as discussed in more detail
below) and by lower accruals for interest on long-term debt.
Our increase in cash flows from operating activities in 2009 compared to 2008 was also driven by
an increase in net income due to greater sales, higher gross margins and lower SG&A expenses as a
percentage of sales. In addition, we experienced increased inventory turns in 2009 as compared to 2008.
Changes in inventory balances increased by 7% in 2009 compared to an increase of 10% in 2008.
Inventory levels in the consumables category increased by $111.4 million, or 15%, in 2009 compared to
an increase of $77.8 million, or 12%, in 2008. The seasonal category increased by $25.3 million, or 9%,
43