Dollar General 2010 Annual Report Download - page 169
Download and view the complete annual report
Please find page 169 of the 2010 Dollar General annual report below. You can navigate through the pages in the report by either clicking on the pages listed below, or by using the keyword search tool below to find specific information within the annual report.-
 1
1 -
2
-
3
-
4
-
5
-
6
-
7
-
8
-
9
-
10
-
11
-
12
-
13
-
14
-
15
-
16
-
17
-
18
-
19
-
20
-
21
-
22
-
23
-
24
-
25
-
26
-
27
-
28
-
29
-
30
-
31
-
32
-
33
-
34
-
35
-
36
-
37
-
38
-
39
-
40
-
41
-
42
-
43
-
44
-
45
-
46
-
47
-
48
-
49
-
50
-
51
-
52
-
53
-
54
-
55
-
56
-
57
-
58
-
59
-
60
-
61
-
62
-
63
-
64
-
65
-
66
-
67
-
68
-
69
-
70
-
71
-
72
-
73
-
74
-
75
-
76
-
77
-
78
-
79
-
80
-
81
-
82
-
83
-
84
-
85
-
86
-
87
-
88
-
89
-
90
-
91
-
92
-
93
-
94
-
95
-
96
-
97
-
98
-
99
-
100
-
101
-
102
-
103
-
104
-
105
-
106
-
107
-
108
-
109
-
110
-
111
-
112
-
113
-
114
-
115
-
116
-
117
-
118
-
119
-
120
-
121
-
122
-
123
-
124
-
125
-
126
-
127
-
128
-
129
-
130
-
131
-
132
-
133
-
134
-
135
-
136
-
137
-
138
-
139
-
140
-
141
-
142
-
143
-
144
-
145
-
146
-
147
-
148
-
149
-
150
-
151
-
152
-
153
-
154
-
155
-
156
-
157
-
158
-
 159
159 -
 160
160 -
 161
161 -
 162
162 -
 163
163 -
 164
164 -
 165
165 -
 166
166 -
 167
167 -
 168
168 -
 169
169 -
 170
170 -
 171
171 -
 172
172 -
 173
173 -
 174
174 -
 175
175 -
 176
176 -
 177
177 -
 178
178 -
 179
179 -
180
-
181
-
182
-
183
-
184
-
185
-
186
-
187
-
188
-
189
-
190
-
191
-
192
-
193
-
194
-
195
-
196
 |
 |

10-K
DOLLAR GENERAL CORPORATION AND SUBSIDIARIES
NOTES TO CONSOLIDATED FINANCIAL STATEMENTS (Continued)
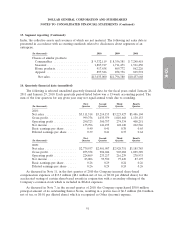
13. Segment reporting (Continued)
India, the collective assets and revenues of which are not material. The following net sales data is
presented in accordance with accounting standards related to disclosures about segments of an
enterprise.
(In thousands) 2010 2009 2008
Classes of similar products:
Consumables .................... $ 9,332,119 $ 8,356,381 $ 7,248,418
Seasonal ........................ 1,887,917 1,711,471 1,521,450
Home products ................... 917,638 869,772 862,226
Apparel ........................ 897,326 858,756 825,574
Net sales ...................... $13,035,000 $11,796,380 $10,457,668
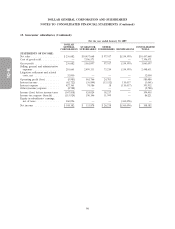
14. Quarterly financial data (unaudited)
The following is selected unaudited quarterly financial data for the fiscal years ended January 28,
2011 and January 29, 2010. Each quarterly period listed below was a 13-week accounting period. The
sum of the four quarters for any given year may not equal annual totals due to rounding.
First Second Third Fourth
(In thousands) Quarter Quarter Quarter Quarter
2010:
Net sales .................. $3,111,314 $3,214,155 $3,223,427 $3,486,104
Gross profit ................ 999,756 1,035,979 1,010,668 1,130,153
Operating profit ............. 290,723 300,757 274,334 408,251
Net income ................ 135,996 141,195 128,120 222,546
Basic earnings per share ....... 0.40 0.41 0.38 0.65
Diluted earnings per share ..... 0.39 0.41 0.37 0.64
First Second Third Fourth
(In thousands) Quarter Quarter Quarter Quarter
2009:
Net sales .................. $2,779,937 $2,901,907 $2,928,751 $3,185,785
Gross profit ................ 855,358 906,042 903,082 1,025,389
Operating profit ............. 224,869 233,217 216,239 278,933
Net income ................ 83,006 93,590 75,649 87,197
Basic earnings per share ....... 0.26 0.29 0.24 0.26
Diluted earnings per share ..... 0.26 0.29 0.24 0.26
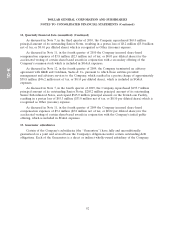
As discussed in Note 11, in the first quarter of 2010 the Company incurred share-based
compensation expenses of $13.3 million ($8.1 million net of tax, or $0.02 per diluted share) for the
accelerated vesting of certain share-based awards in conjunction with a secondary offering of the
Company’s common stock which is included in SG&A expenses.
As discussed in Note 7, in the second quarter of 2010, the Company repurchased $50.0 million
principal amount of its outstanding Senior Notes, resulting in a pretax loss of $6.5 million ($4.0 million
net of tax, or $0.01 per diluted share) which is recognized as Other (income) expense.
91