Dollar General 2010 Annual Report Download - page 110
Download and view the complete annual report
Please find page 110 of the 2010 Dollar General annual report below. You can navigate through the pages in the report by either clicking on the pages listed below, or by using the keyword search tool below to find specific information within the annual report.-
 1
1 -
2
-
3
-
4
-
5
-
6
-
7
-
8
-
9
-
10
-
11
-
12
-
13
-
14
-
15
-
16
-
17
-
18
-
19
-
20
-
21
-
22
-
23
-
24
-
25
-
26
-
27
-
28
-
29
-
30
-
31
-
32
-
33
-
34
-
35
-
36
-
37
-
38
-
39
-
40
-
41
-
42
-
43
-
44
-
45
-
46
-
47
-
48
-
49
-
50
-
51
-
52
-
53
-
54
-
55
-
56
-
57
-
58
-
59
-
60
-
61
-
62
-
63
-
64
-
65
-
66
-
67
-
68
-
69
-
70
-
71
-
72
-
73
-
74
-
75
-
76
-
77
-
78
-
79
-
80
-
81
-
82
-
83
-
84
-
85
-
86
-
87
-
88
-
89
-
90
-
91
-
92
-
93
-
94
-
95
-
96
-
97
-
98
-
99
-
 100
100 -
 101
101 -
 102
102 -
 103
103 -
 104
104 -
 105
105 -
 106
106 -
 107
107 -
 108
108 -
 109
109 -
 110
110 -
 111
111 -
 112
112 -
 113
113 -
 114
114 -
 115
115 -
 116
116 -
 117
117 -
 118
118 -
 119
119 -
 120
120 -
121
-
122
-
123
-
124
-
125
-
126
-
127
-
128
-
129
-
130
-
131
-
132
-
133
-
134
-
135
-
136
-
137
-
138
-
139
-
140
-
141
-
142
-
143
-
144
-
145
-
146
-
147
-
148
-
149
-
150
-
151
-
152
-
153
-
154
-
155
-
156
-
157
-
158
-
159
-
160
-
161
-
162
-
163
-
164
-
165
-
166
-
167
-
168
-
169
-
170
-
171
-
172
-
173
-
174
-
175
-
176
-
177
-
178
-
179
-
180
-
181
-
182
-
183
-
184
-
185
-
186
-
187
-
188
-
189
-
190
-
191
-
192
-
193
-
194
-
195
-
196
 |
 |

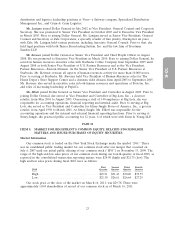
10-K
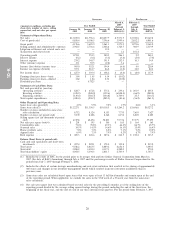
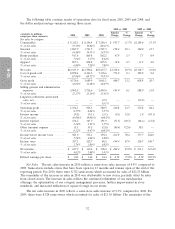
The following table contains results of operations data for fiscal years 2010, 2009 and 2008, and
the dollar and percentage variances among those years.
2010 vs. 2009 2009 vs. 2008
Amount % Amount %
(amounts in millions, 2010 2009 2008 Change Change Change Change
except per share amounts)
Net sales by category:
Consumables ................. $9,332.1 $ 8,356.4 $ 7,248.4 $ 975.7 11.7% $1,108.0 15.3%
% of net sales ................ 71.59% 70.84% 69.31%
Seasonal .................... 1,887.9 1,711.5 1,521.5 176.4 10.3 190.0 12.5
% of net sales ................ 14.48% 14.51% 14.55%
Home products ............... 917.6 869.8 862.2 47.9 5.5 7.5 0.9
% of net sales ................ 7.04% 7.37% 8.24%
Apparel .................... 897.3 858.8 825.6 38.6 4.5 33.2 4.0
% of net sales ................ 6.88% 7.28% 7.89%
Net sales ................... $13,035.0 $11,796.4 $10,457.7 $1,238.6 10.5% $1,338.7 12.8%
Cost of goods sold ............. 8,858.4 8,106.5 7,396.6 751.9 9.3 709.9 9.6
% of net sales ................ 67.96% 68.72% 70.73%
Gross profit ................. 4,176.6 3,689.9 3,061.1 486.7 13.2 628.8 20.5
% of net sales ................ 32.04% 31.28% 29.27%
Selling, general and administrative
expenses .................. 2,902.5 2,736.6 2,448.6 165.9 6.1 288.0 11.8
% of net sales ................ 22.27% 23.20% 23.41%
Litigation settlement and related
costs, net .................. — — 32.0 — — (32.0) —
% of net sales ................ — — 0.31%
Operating profit ............... 1,274.1 953.3 580.5 320.8 33.7 372.8 64.2
% of net sales ................ 9.77% 8.08% 5.55%
Interest income ............... (0.2) (0.1) (3.1) (0.1) 52.8 2.9 (95.3)
% of net sales ................ (0.00)% (0.00)% (0.03)%
Interest expense ............... 274.2 345.7 391.9 (71.5) (20.7) (46.2) (11.8)
% of net sales ................ 2.10% 2.93% 3.75%
Other (income) expense ......... 15.1 55.5 (2.8) (40.4) (72.8) 58.3 —
% of net sales ................ 0.12% 0.47% (0.03)%
Income before income taxes ...... 985.0 552.1 194.4 432.9 78.4 357.7 184.0
% of net sales ................ 7.56% 4.68% 1.86%
Income taxes ................. 357.1 212.7 86.2 144.4 67.9 126.5 146.7
% of net sales ................ 2.74% 1.80% 0.82%
Net income .................. $ 627.9 $ 339.4 $ 108.2 $ 288.4 85.0% $ 231.3 213.8%
% of net sales ................ 4.82% 2.88% 1.03%
Diluted earnings per share ....... $ 1.82 $ 1.04 $ 0.34 $ 0.78 75.0% $ 0.70 205.9%
Net Sales. The net sales increase in 2010 reflects a same-store sales increase of 4.9% compared to
2009. Same-stores include stores that have been open for 13 months and remain open at the end of the
reporting period. For 2010, there were 8,712 same-stores which accounted for sales of $12.23 billion.
The remainder of the increase in sales in 2010 was attributable to new stores, partially offset by sales
from closed stores. The increase in sales reflects the continued refinement of our merchandise
offerings, the optimization of our category management processes, further improvement in store
standards, and increased utilization of square footage in our stores.
The net sales increase in 2009 reflects a same-store sales increase of 9.5% compared to 2008. For
2009, there were 8,324 same-stores which accounted for sales of $11.36 billion. The remainder of the
32