Dollar General 2010 Annual Report Download - page 39
Download and view the complete annual report
Please find page 39 of the 2010 Dollar General annual report below. You can navigate through the pages in the report by either clicking on the pages listed below, or by using the keyword search tool below to find specific information within the annual report.-
 1
1 -
2
-
3
-
4
-
5
-
6
-
7
-
8
-
9
-
10
-
11
-
12
-
13
-
14
-
15
-
16
-
17
-
18
-
19
-
20
-
21
-
22
-
23
-
24
-
25
-
26
-
27
-
28
-
 29
29 -
 30
30 -
 31
31 -
 32
32 -
 33
33 -
 34
34 -
 35
35 -
 36
36 -
 37
37 -
 38
38 -
 39
39 -
 40
40 -
 41
41 -
 42
42 -
 43
43 -
 44
44 -
 45
45 -
 46
46 -
 47
47 -
 48
48 -
 49
49 -
50
-
51
-
52
-
53
-
54
-
55
-
56
-
57
-
58
-
59
-
60
-
61
-
62
-
63
-
64
-
65
-
66
-
67
-
68
-
69
-
70
-
71
-
72
-
73
-
74
-
75
-
76
-
77
-
78
-
79
-
80
-
81
-
82
-
83
-
84
-
85
-
86
-
87
-
88
-
89
-
90
-
91
-
92
-
93
-
94
-
95
-
96
-
97
-
98
-
99
-
100
-
101
-
102
-
103
-
104
-
105
-
106
-
107
-
108
-
109
-
110
-
111
-
112
-
113
-
114
-
115
-
116
-
117
-
118
-
119
-
120
-
121
-
122
-
123
-
124
-
125
-
126
-
127
-
128
-
129
-
130
-
131
-
132
-
133
-
134
-
135
-
136
-
137
-
138
-
139
-
140
-
141
-
142
-
143
-
144
-
145
-
146
-
147
-
148
-
149
-
150
-
151
-
152
-
153
-
154
-
155
-
156
-
157
-
158
-
159
-
160
-
161
-
162
-
163
-
164
-
165
-
166
-
167
-
168
-
169
-
170
-
171
-
172
-
173
-
174
-
175
-
176
-
177
-
178
-
179
-
180
-
181
-
182
-
183
-
184
-
185
-
186
-
187
-
188
-
189
-
190
-
191
-
192
-
193
-
194
-
195
-
196
 |
 |

Proxy
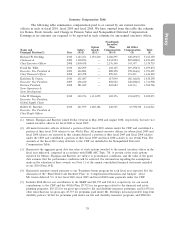
determined the ROIC level that would result if we were to achieve 110% of the adjusted EBITDA
target performance level. We then divided the difference between that ROIC level and the threshold
ROIC level described above over pro rata increments between those levels to arrive at the ROIC target
performance level.
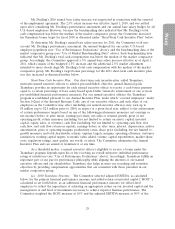
The bonus payable to each named executive officer if we reached the 2010 target performance
levels for each of the adjusted EBITDA and ROIC financial performance measures is equal to the
applicable percentage of each executive’s salary as set forth in the chart below. Except for Mr. Dreiling,
such payout percentages, which are consistent with Teamshare payout percentages for prior years,
continued to fall within the median of the payout percentages for the market comparator group. As
discussed under ‘‘Base Salary’’ above, the Committee increased Mr. Dreiling’s bonus target from 100%
to 125% of his base salary in 2010 and to 130% in 2011 in order to more closely align Mr. Dreiling’s
bonus target and total cash compensation with the median of the market comparator group.
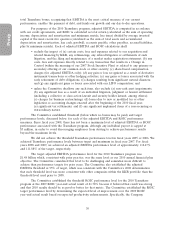
Name Target Payout Percentage
Mr. Dreiling(1) 125%
Mr. Tehle 65%
Ms. Guion 65%
Mr. Flanigan 65%
Mr. Ravener 65%
(1) Mr. Dreiling’s minimum threshold (50%) and target (125%) bonus percentages are
established in his employment agreement with us.
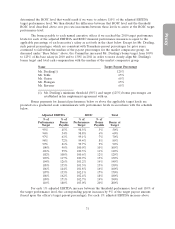
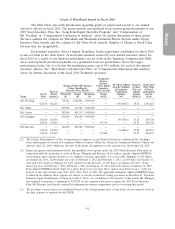
Bonus payments for financial performance below or above the applicable target levels are
prorated on a graduated scale commensurate with performance levels in accordance with the schedule
below.
Adjusted EBITDA ROIC Total
% of % of % of % of
Performance Bonus Performance Bonus Bonus at
Target Payable Target Payable Target
95% 45% 98.5% 5% 50%
96% 54% 98.8% 6% 60%
97% 63% 99.1% 7% 70%
98% 72% 99.4% 8% 80%
99% 81% 99.7% 9% 90%
100% 90% 100.0% 10% 100%
101% 99% 100.3% 11% 110%
102% 108% 100.6% 12% 120%
103% 117% 100.9% 13% 130%
104% 126% 101.2% 14% 140%
105% 135% 101.5% 15% 150%
106% 144% 101.8% 16% 160%
107% 153% 102.1% 17% 170%
108% 162% 102.4% 18% 180%
109% 171% 102.7% 19% 190%
110% 180% 103.0% 20% 200%
For each 1% adjusted EBITDA increase between the threshold performance level and 110% of
the target performance level, the corresponding payout increases by 9% of the target payout amount
(based upon the officer’s target payout percentage). For each 1% adjusted EBITDA increase above
31