Dollar General 2010 Annual Report Download - page 175
Download and view the complete annual report
Please find page 175 of the 2010 Dollar General annual report below. You can navigate through the pages in the report by either clicking on the pages listed below, or by using the keyword search tool below to find specific information within the annual report.-
 1
1 -
2
-
3
-
4
-
5
-
6
-
7
-
8
-
9
-
10
-
11
-
12
-
13
-
14
-
15
-
16
-
17
-
18
-
19
-
20
-
21
-
22
-
23
-
24
-
25
-
26
-
27
-
28
-
29
-
30
-
31
-
32
-
33
-
34
-
35
-
36
-
37
-
38
-
39
-
40
-
41
-
42
-
43
-
44
-
45
-
46
-
47
-
48
-
49
-
50
-
51
-
52
-
53
-
54
-
55
-
56
-
57
-
58
-
59
-
60
-
61
-
62
-
63
-
64
-
65
-
66
-
67
-
68
-
69
-
70
-
71
-
72
-
73
-
74
-
75
-
76
-
77
-
78
-
79
-
80
-
81
-
82
-
83
-
84
-
85
-
86
-
87
-
88
-
89
-
90
-
91
-
92
-
93
-
94
-
95
-
96
-
97
-
98
-
99
-
100
-
101
-
102
-
103
-
104
-
105
-
106
-
107
-
108
-
109
-
110
-
111
-
112
-
113
-
114
-
115
-
116
-
117
-
118
-
119
-
120
-
121
-
122
-
123
-
124
-
125
-
126
-
127
-
128
-
129
-
130
-
131
-
132
-
133
-
134
-
135
-
136
-
137
-
138
-
139
-
140
-
141
-
142
-
143
-
144
-
145
-
146
-
147
-
148
-
149
-
150
-
151
-
152
-
153
-
154
-
155
-
156
-
157
-
158
-
159
-
160
-
161
-
162
-
163
-
164
-
 165
165 -
 166
166 -
 167
167 -
 168
168 -
 169
169 -
 170
170 -
 171
171 -
 172
172 -
 173
173 -
 174
174 -
 175
175 -
 176
176 -
 177
177 -
 178
178 -
 179
179 -
 180
180 -
 181
181 -
 182
182 -
 183
183 -
 184
184 -
 185
185 -
186
-
187
-
188
-
189
-
190
-
191
-
192
-
193
-
194
-
195
-
196
 |
 |

10-K
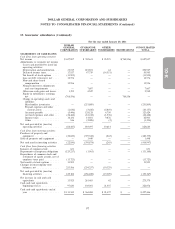
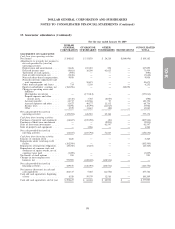
DOLLAR GENERAL CORPORATION AND SUBSIDIARIES
NOTES TO CONSOLIDATED FINANCIAL STATEMENTS (Continued)
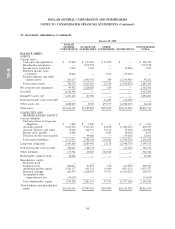
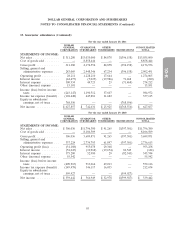
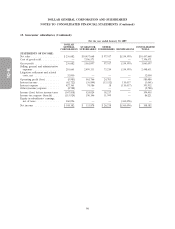
15. Guarantor subsidiaries (Continued)
For the year ended January 28, 2011
DOLLAR
GENERAL GUARANTOR OTHER CONSOLIDATED
CORPORATION SUBSIDIARIES SUBSIDIARIES ELIMINATIONS TOTAL
STATEMENTS OF CASH FLOWS:
Cash flows from operating activities:
Net income ................ $627,857 $ 742,631 $ 25,925 $(768,556) $ 627,857
Adjustments to reconcile net income
to net cash provided by (used in)
operating activities:
Depreciation and amortization . . 33,015 221,851 61 — 254,927
Deferred income taxes ........ 17,817 47,719 (14,551) — 50,985
Tax benefit of stock options .... (13,905) — — — (13,905)
Loss on debt retirement, net .... 14,576 — — — 14,576
Non-cash share-based
compensation ............ 15,956 — — — 15,956
Noncash inventory adjustments
and asset impairments ...... — 7,607 — — 7,607
Other non-cash gains and losses . . 1,395 4,547 — — 5,942
Equity in subsidiaries’ earnings,
net................... (768,556) — — 768,556 —
Change in operating assets and
liabilities:
Merchandise inventories ..... — (251,809) — — (251,809)
Prepaid expenses and other
current assets .......... (1,646) (3,642) (4,869) — (10,157)
Accounts payable ......... (5,446) 124,120 4,750 — 123,424
Accrued expenses and other . . . (28,442) (12,410) (1,576) — (42,428)
Income taxes ............ 18,136 14,891 9,876 — 42,903
Other ................. 816 (2,008) (2) — (1,194)
Net cash provided by (used in)
operating activities .......... (88,427) 893,497 19,614 — 824,684
Cash flows from investing activities:
Purchases of property and
equipment ............... (22,830) (397,322) (243) — (420,395)
Sales of property and equipment . . . — 1,448 — — 1,448
Net cash used in investing activities . (22,830) (395,874) (243) — (418,947)
Cash flows from financing activities:
Issuance of common stock ....... 631 — — — 631
Repayments of long-term obligations (129,217) (1,963) — — (131,180)
Repurchases of common stock and
settlement of equity awards, net of
employee taxes paid ......... (13,723) — — — (13,723)
Tax benefit of stock options ...... 13,905 — — — 13,905
Changes in intercompany note
balances, net .............. 253,586 (234,257) (19,329) — —
Net cash provided by (used in)
financing activities .......... 125,182 (236,220) (19,329) — (130,367)
Net increase in cash and cash
equivalents ............... 13,925 261,403 42 — 275,370
Cash and cash equivalents,
beginning of year ........... 97,620 103,001 21,455 — 222,076
Cash and cash equivalents, end of
year ................... $111,545 $ 364,404 $ 21,497 $ — $ 497,446
97