Dollar General 2010 Annual Report Download - page 131
Download and view the complete annual report
Please find page 131 of the 2010 Dollar General annual report below. You can navigate through the pages in the report by either clicking on the pages listed below, or by using the keyword search tool below to find specific information within the annual report.-
 1
1 -
2
-
3
-
4
-
5
-
6
-
7
-
8
-
9
-
10
-
11
-
12
-
13
-
14
-
15
-
16
-
17
-
18
-
19
-
20
-
21
-
22
-
23
-
24
-
25
-
26
-
27
-
28
-
29
-
30
-
31
-
32
-
33
-
34
-
35
-
36
-
37
-
38
-
39
-
40
-
41
-
42
-
43
-
44
-
45
-
46
-
47
-
48
-
49
-
50
-
51
-
52
-
53
-
54
-
55
-
56
-
57
-
58
-
59
-
60
-
61
-
62
-
63
-
64
-
65
-
66
-
67
-
68
-
69
-
70
-
71
-
72
-
73
-
74
-
75
-
76
-
77
-
78
-
79
-
80
-
81
-
82
-
83
-
84
-
85
-
86
-
87
-
88
-
89
-
90
-
91
-
92
-
93
-
94
-
95
-
96
-
97
-
98
-
99
-
100
-
101
-
102
-
103
-
104
-
105
-
106
-
107
-
108
-
109
-
110
-
111
-
112
-
113
-
114
-
115
-
116
-
117
-
118
-
119
-
120
-
 121
121 -
 122
122 -
 123
123 -
 124
124 -
 125
125 -
 126
126 -
 127
127 -
 128
128 -
 129
129 -
 130
130 -
 131
131 -
 132
132 -
 133
133 -
 134
134 -
 135
135 -
 136
136 -
 137
137 -
 138
138 -
 139
139 -
 140
140 -
 141
141 -
142
-
143
-
144
-
145
-
146
-
147
-
148
-
149
-
150
-
151
-
152
-
153
-
154
-
155
-
156
-
157
-
158
-
159
-
160
-
161
-
162
-
163
-
164
-
165
-
166
-
167
-
168
-
169
-
170
-
171
-
172
-
173
-
174
-
175
-
176
-
177
-
178
-
179
-
180
-
181
-
182
-
183
-
184
-
185
-
186
-
187
-
188
-
189
-
190
-
191
-
192
-
193
-
194
-
195
-
196
 |
 |

10-K
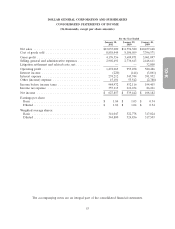
DOLLAR GENERAL CORPORATION AND SUBSIDIARIES
CONSOLIDATED STATEMENTS OF INCOME
(In thousands, except per share amounts)
For the Year Ended
January 28, January 29, January 30,
2011 2010 2009
Net sales ...................................... $13,035,000 $11,796,380 $10,457,668
Cost of goods sold ............................... 8,858,444 8,106,509 7,396,571
Gross profit .................................... 4,176,556 3,689,871 3,061,097
Selling, general and administrative expenses ............. 2,902,491 2,736,613 2,448,611
Litigation settlement and related costs, net .............. — — 32,000
Operating profit ................................. 1,274,065 953,258 580,486
Interest income ................................. (220) (144) (3,061)
Interest expense ................................. 274,212 345,744 391,932
Other (income) expense ........................... 15,101 55,542 (2,788)
Income before income taxes ........................ 984,972 552,116 194,403
Income tax expense .............................. 357,115 212,674 86,221
Net income .................................... $ 627,857 $ 339,442 $ 108,182
Earnings per share:
Basic ....................................... $ 1.84 $ 1.05 $ 0.34
Diluted ...................................... $ 1.82 $ 1.04 $ 0.34
Weighted average shares:
Basic ....................................... 341,047 322,778 317,024
Diluted ...................................... 344,800 324,836 317,503
The accompanying notes are an integral part of the consolidated financial statements.
53