Dollar General 2010 Annual Report Download - page 104
Download and view the complete annual report
Please find page 104 of the 2010 Dollar General annual report below. You can navigate through the pages in the report by either clicking on the pages listed below, or by using the keyword search tool below to find specific information within the annual report.-
 1
1 -
2
-
3
-
4
-
5
-
6
-
7
-
8
-
9
-
10
-
11
-
12
-
13
-
14
-
15
-
16
-
17
-
18
-
19
-
20
-
21
-
22
-
23
-
24
-
25
-
26
-
27
-
28
-
29
-
30
-
31
-
32
-
33
-
34
-
35
-
36
-
37
-
38
-
39
-
40
-
41
-
42
-
43
-
44
-
45
-
46
-
47
-
48
-
49
-
50
-
51
-
52
-
53
-
54
-
55
-
56
-
57
-
58
-
59
-
60
-
61
-
62
-
63
-
64
-
65
-
66
-
67
-
68
-
69
-
70
-
71
-
72
-
73
-
74
-
75
-
76
-
77
-
78
-
79
-
80
-
81
-
82
-
83
-
84
-
85
-
86
-
87
-
88
-
89
-
90
-
91
-
92
-
93
-
 94
94 -
 95
95 -
 96
96 -
 97
97 -
 98
98 -
 99
99 -
 100
100 -
 101
101 -
 102
102 -
 103
103 -
 104
104 -
 105
105 -
 106
106 -
 107
107 -
 108
108 -
 109
109 -
 110
110 -
 111
111 -
 112
112 -
 113
113 -
 114
114 -
115
-
116
-
117
-
118
-
119
-
120
-
121
-
122
-
123
-
124
-
125
-
126
-
127
-
128
-
129
-
130
-
131
-
132
-
133
-
134
-
135
-
136
-
137
-
138
-
139
-
140
-
141
-
142
-
143
-
144
-
145
-
146
-
147
-
148
-
149
-
150
-
151
-
152
-
153
-
154
-
155
-
156
-
157
-
158
-
159
-
160
-
161
-
162
-
163
-
164
-
165
-
166
-
167
-
168
-
169
-
170
-
171
-
172
-
173
-
174
-
175
-
176
-
177
-
178
-
179
-
180
-
181
-
182
-
183
-
184
-
185
-
186
-
187
-
188
-
189
-
190
-
191
-
192
-
193
-
194
-
195
-
196
 |
 |

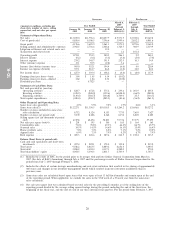
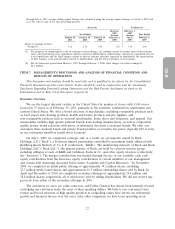
10-K
Successor Predecessor
March 6, February 3,
2007 2007
Year Ended Year Ended
(Amounts in millions, excluding per through through
share data, number of stores, selling January 28, January 29, January 30, February 1, July 6, February 2,
square feet, and net sales per square 2011 2010 2009 2008(1)(2) 2007(2) 2007(2)
foot)
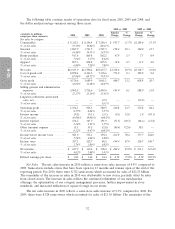
Statement of Operations Data:
Net sales ...................... $13,035.0 $11,796.4 $10,457.7 $ 5,571.5 $3,923.8 $9,169.8
Cost of goods sold ................ 8,858.4 8,106.5 7,396.6 3,999.6 2,852.2 6,801.6
Gross profit .................... 4,176.6 3,689.9 3,061.1 1,571.9 1,071.6 2,368.2
Selling, general and administrative expenses 2,902.5 2,736.6 2,448.6 1,324.5 960.9 2,119.9
Litigation settlement and related costs, net . — — 32.0 — — —
Transaction and related costs ......... — — — 1.2 101.4 —
Operating profit ................. 1,274.1 953.3 580.5 246.1 9.2 248.3
Interest income .................. (0.2) (0.1) (3.1) (3.8) (5.0) (7.0)
Interest expense ................. 274.2 345.7 391.9 252.9 10.3 34.9
Other (income) expense ............ 15.1 55.5 (2.8) 3.6 — —
Income (loss) before income taxes ...... 985.0 552.1 194.4 (6.6) 4.0 220.4
Income tax expense (benefit) ......... 357.1 212.7 86.2 (1.8) 12.0 82.4
Net income (loss) ................ $ 627.9 $ 339.4 $ 108.2 $ (4.8) $ (8.0) $ 137.9
Earnings (loss) per share—basic ....... $ 1.84 $ 1.05 $ 0.34 $ (0.02)
Earnings (loss) per share—diluted ...... 1.82 1.04 0.34 (0.02)
Dividends per share ............... — 0.7525 — —
Statement of Cash Flows Data:
Net cash provided by (used in):
Operating activities .............. $ 824.7 $ 672.8 $ 575.2 $ 239.6 $ 201.9 $ 405.4
Investing activities ............... (418.9) (248.0) (152.6) (6,848.4) (66.9) (282.0)
Financing activities .............. (130.4) (580.7) (144.8) 6,709.0 25.3 (134.7)
Total capital expenditures ............ (420.4) (250.7) (205.5) (83.6) (56.2) (261.5)
Other Financial and Operating Data:
Same store sales growth(3) ........... 4.9% 9.5% 9.0% 1.9% 2.6% 3.3%
Same store sales(3) ............... $12,227.1 $11,356.5 $10,118.5 $ 5,264.2 $3,656.6 $8,327.2
Number of stores included in same store
sales calculation ................ 8,712 8,324 8,153 7,735 7,655 7,627
Number of stores (at period end) ...... 9,372 8,828 8,362 8,194 8,205 8,229
Selling square feet (in thousands at period
end) ....................... 67,094 62,494 58,803 57,376 57,379 57,299
Net sales per square foot(4) .......... $ 201 $ 195 $ 180 $ 165 $ 164 $ 163
Consumables sales ................ 71.6% 70.8% 69.3% 66.4% 66.7% 65.7%
Seasonal sales ................... 14.5% 14.5% 14.6% 16.3% 15.4% 16.4%
Home products sales ............... 7.0% 7.4% 8.2% 9.1% 9.2% 10.0%
Apparel sales ................... 6.9% 7.3% 7.9% 8.2% 8.7% 7.9%
Rent expense ................... $ 489.3 $ 428.6 $ 389.6 $ 214.5 $ 150.2 $ 343.9
Balance Sheet Data (at period end):
Cash and cash equivalents and short-term
investments ................... $ 497.4 $ 222.1 $ 378.0 $ 119.8 $ 219.2
Total assets ..................... 9,546.2 8,863.5 8,889.2 8,656.4 3,040.5
Total debt ..................... 3,288.2 3,403.4 4,137.1 4,282.0 270.0
Total shareholders’ equity ........... 4,054.5 3,390.3 2,831.7 2,703.9 1,745.7
(1) Includes the results of BAC for the period prior to its merger with and into Dollar General Corporation from March 6,
2007 (the date of BAC’s formation) through July 6, 2007 and the post-merger results of Dollar General Corporation for the
period from July 7, 2007 through February 1, 2008.
(2) Includes the effects of certain strategic merchandising and real estate initiatives that resulted in the closing of approximately
460 stores and changes in our inventory management model which resulted in greater inventory markdowns than in
previous years.
(3) Same-store sales are calculated based upon stores that were open at least 13 full fiscal months and remain open at the end
of the reporting period. When applicable, we exclude the sales in the 53rd week of a 53-week year from the same-store
sales calculation.
(4) Net sales per square foot was calculated based on total sales for the preceding 12 months as of the ending date of the
reporting period divided by the average selling square footage during the period, including the end of the fiscal year, the
beginning of the fiscal year, and the end of each of our three interim fiscal quarters. For the period from February 3, 2007
26