Dollar General 2010 Annual Report Download - page 146
Download and view the complete annual report
Please find page 146 of the 2010 Dollar General annual report below. You can navigate through the pages in the report by either clicking on the pages listed below, or by using the keyword search tool below to find specific information within the annual report.-
 1
1 -
2
-
3
-
4
-
5
-
6
-
7
-
8
-
9
-
10
-
11
-
12
-
13
-
14
-
15
-
16
-
17
-
18
-
19
-
20
-
21
-
22
-
23
-
24
-
25
-
26
-
27
-
28
-
29
-
30
-
31
-
32
-
33
-
34
-
35
-
36
-
37
-
38
-
39
-
40
-
41
-
42
-
43
-
44
-
45
-
46
-
47
-
48
-
49
-
50
-
51
-
52
-
53
-
54
-
55
-
56
-
57
-
58
-
59
-
60
-
61
-
62
-
63
-
64
-
65
-
66
-
67
-
68
-
69
-
70
-
71
-
72
-
73
-
74
-
75
-
76
-
77
-
78
-
79
-
80
-
81
-
82
-
83
-
84
-
85
-
86
-
87
-
88
-
89
-
90
-
91
-
92
-
93
-
94
-
95
-
96
-
97
-
98
-
99
-
100
-
101
-
102
-
103
-
104
-
105
-
106
-
107
-
108
-
109
-
110
-
111
-
112
-
113
-
114
-
115
-
116
-
117
-
118
-
119
-
120
-
121
-
122
-
123
-
124
-
125
-
126
-
127
-
128
-
129
-
130
-
131
-
132
-
133
-
134
-
135
-
 136
136 -
 137
137 -
 138
138 -
 139
139 -
 140
140 -
 141
141 -
 142
142 -
 143
143 -
 144
144 -
 145
145 -
 146
146 -
 147
147 -
 148
148 -
 149
149 -
 150
150 -
 151
151 -
 152
152 -
 153
153 -
 154
154 -
 155
155 -
 156
156 -
157
-
158
-
159
-
160
-
161
-
162
-
163
-
164
-
165
-
166
-
167
-
168
-
169
-
170
-
171
-
172
-
173
-
174
-
175
-
176
-
177
-
178
-
179
-
180
-
181
-
182
-
183
-
184
-
185
-
186
-
187
-
188
-
189
-
190
-
191
-
192
-
193
-
194
-
195
-
196
 |
 |

10-K
DOLLAR GENERAL CORPORATION AND SUBSIDIARIES
NOTES TO CONSOLIDATED FINANCIAL STATEMENTS (Continued)
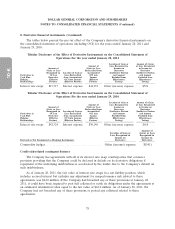
3. Merger (Continued)
cash flows associated with the Company’s intangible assets are not expected to be materially affected by
the Company’s intent or ability to renew or extend the arrangements.
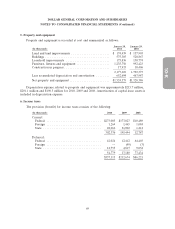
For intangible assets subject to amortization, the estimated aggregate amortization expense for
each of the five succeeding fiscal years is as follows: 2011—$20.9 million, 2012—$17.0 million, 2013—
$12.0 million, 2014—$5.8 million and 2015—$0.9 million.
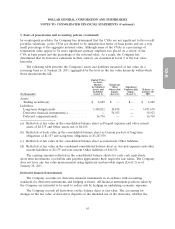
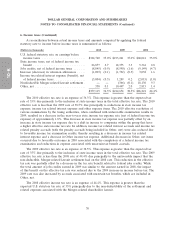
4. Earnings per share
Earnings per share is computed as follows (in thousands except per share data):
2010
Net Weighted Average Per Share
Income Shares Amount
Basic earnings per share ................ $627,857 341,047 $1.84
Effect of dilutive share-based awards ....... 3,753
Diluted earnings per share ............... $627,857 344,800 $1.82
2009
Net Weighted Average Per Share
Income Shares Amount
Basic earnings per share ................ $339,442 322,778 $1.05
Effect of dilutive share-based awards ....... 2,058
Diluted earnings per share ............... $339,442 324,836 $1.04
2008
Net Weighted Average Per Share
Income Shares Amount
Basic earnings per share ................ $108,182 317,024 $0.34
Effect of dilutive share-based awards ....... 479
Diluted earnings per share ............... $108,182 317,503 $0.34
Basic earnings per share was computed by dividing net income by the weighted average number of
shares of common stock outstanding during the year. Diluted earnings per share was determined based
on the dilutive effect of share-based awards using the treasury stock method.
Options to purchase shares of common stock that were outstanding at the end of the respective
periods, but were not included in the computation of diluted earnings per share because the effect of
exercising such options would be antidilutive, were 0.4 million, 0.2 million and 12.1 million in 2010,
2009 and 2008, respectively.
68