Dollar General 2010 Annual Report Download - page 140
Download and view the complete annual report
Please find page 140 of the 2010 Dollar General annual report below. You can navigate through the pages in the report by either clicking on the pages listed below, or by using the keyword search tool below to find specific information within the annual report.-
 1
1 -
2
-
3
-
4
-
5
-
6
-
7
-
8
-
9
-
10
-
11
-
12
-
13
-
14
-
15
-
16
-
17
-
18
-
19
-
20
-
21
-
22
-
23
-
24
-
25
-
26
-
27
-
28
-
29
-
30
-
31
-
32
-
33
-
34
-
35
-
36
-
37
-
38
-
39
-
40
-
41
-
42
-
43
-
44
-
45
-
46
-
47
-
48
-
49
-
50
-
51
-
52
-
53
-
54
-
55
-
56
-
57
-
58
-
59
-
60
-
61
-
62
-
63
-
64
-
65
-
66
-
67
-
68
-
69
-
70
-
71
-
72
-
73
-
74
-
75
-
76
-
77
-
78
-
79
-
80
-
81
-
82
-
83
-
84
-
85
-
86
-
87
-
88
-
89
-
90
-
91
-
92
-
93
-
94
-
95
-
96
-
97
-
98
-
99
-
100
-
101
-
102
-
103
-
104
-
105
-
106
-
107
-
108
-
109
-
110
-
111
-
112
-
113
-
114
-
115
-
116
-
117
-
118
-
119
-
120
-
121
-
122
-
123
-
124
-
125
-
126
-
127
-
128
-
129
-
 130
130 -
 131
131 -
 132
132 -
 133
133 -
 134
134 -
 135
135 -
 136
136 -
 137
137 -
 138
138 -
 139
139 -
 140
140 -
 141
141 -
 142
142 -
 143
143 -
 144
144 -
 145
145 -
 146
146 -
 147
147 -
 148
148 -
 149
149 -
 150
150 -
151
-
152
-
153
-
154
-
155
-
156
-
157
-
158
-
159
-
160
-
161
-
162
-
163
-
164
-
165
-
166
-
167
-
168
-
169
-
170
-
171
-
172
-
173
-
174
-
175
-
176
-
177
-
178
-
179
-
180
-
181
-
182
-
183
-
184
-
185
-
186
-
187
-
188
-
189
-
190
-
191
-
192
-
193
-
194
-
195
-
196
 |
 |

10-K
DOLLAR GENERAL CORPORATION AND SUBSIDIARIES
NOTES TO CONSOLIDATED FINANCIAL STATEMENTS (Continued)
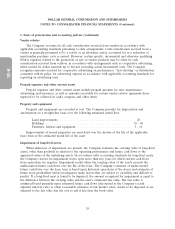
1. Basis of presentation and accounting policies (Continued)
Fair value accounting
The Company utilizes accounting standards for fair value, which include the definition of fair
value, the framework for measuring fair value, and disclosures about fair value measurements. Fair
value is a market-based measurement, not an entity-specific measurement. Therefore, a fair value
measurement should be determined based on the assumptions that market participants would use in
pricing the asset or liability. As a basis for considering market participant assumptions in fair value
measurements, fair value accounting standards establish a fair value hierarchy that distinguishes
between market participant assumptions based on market data obtained from sources independent of
the reporting entity (observable inputs that are classified within Levels 1 and 2 of the hierarchy) and
the reporting entity’s own assumptions about market participant assumptions (unobservable inputs
classified within Level 3 of the hierarchy).
Level 1 inputs utilize quoted prices (unadjusted) in active markets for identical assets or liabilities
that the Company has the ability to access. Level 2 inputs are inputs other than quoted prices included
in Level 1 that are directly or indirectly observable for the asset or liability. Level 2 inputs may include
quoted prices for similar assets and liabilities in active markets, as well as inputs that are observable for
the asset or liability (other than quoted prices), such as interest rates, foreign exchange rates, and yield
curves that are observable at commonly quoted intervals. Level 3 inputs are unobservable inputs for the
asset or liability, which are based on an entity’s own assumptions, as there is little, if any, related
market activity. In instances where the determination of the fair value measurement is based on inputs
from different levels of the fair value hierarchy, the level in the fair value hierarchy within which the
entire fair value measurement falls is based on the lowest level input that is significant to the fair value
measurement in its entirety. The Company’s assessment of the significance of a particular input to the
fair value measurement in its entirety requires judgment and considers factors specific to the asset or
liability.
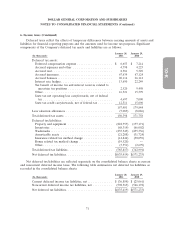
The valuation of the Company’s derivative financial instruments is determined using widely
accepted valuation techniques, including discounted cash flow analysis on the expected cash flows of
each derivative. This analysis reflects the contractual terms of the derivatives, including the period to
maturity, and uses observable market-based inputs, including interest rate curves. The fair values of
interest rate swaps are determined using the market standard methodology of netting the discounted
future fixed cash payments (or receipts) and the discounted expected variable cash receipts (or
payments). The variable cash receipts (or payments) are based on an expectation of future interest
rates (forward curves) derived from observable market interest rate curves.
The Company incorporates credit valuation adjustments (CVAs) to appropriately reflect both its
own nonperformance risk and the respective counterparty’s nonperformance risk in the fair value
measurements. In adjusting the fair value of its derivative contracts for the effect of nonperformance
risk, the Company has considered the impact of netting and any applicable credit enhancements, such
as collateral postings, thresholds, mutual puts, and guarantees.
The Company has determined that the majority of the inputs used to value its derivatives fall
within Level 2 of the fair value hierarchy. However, the CVAs associated with its derivatives utilize
Level 3 inputs, such as estimates of current credit spreads to evaluate the likelihood of default by itself
and its counterparties. As of January 28, 2011, the Company has assessed the significance of the impact
of the CVAs on the overall valuation of its derivative positions and has determined that the CVAs are
not significant to the overall valuation of its derivatives. Based on the Company’s review of the CVAs
62