Dollar General 2010 Annual Report Download - page 113
Download and view the complete annual report
Please find page 113 of the 2010 Dollar General annual report below. You can navigate through the pages in the report by either clicking on the pages listed below, or by using the keyword search tool below to find specific information within the annual report.-
 1
1 -
2
-
3
-
4
-
5
-
6
-
7
-
8
-
9
-
10
-
11
-
12
-
13
-
14
-
15
-
16
-
17
-
18
-
19
-
20
-
21
-
22
-
23
-
24
-
25
-
26
-
27
-
28
-
29
-
30
-
31
-
32
-
33
-
34
-
35
-
36
-
37
-
38
-
39
-
40
-
41
-
42
-
43
-
44
-
45
-
46
-
47
-
48
-
49
-
50
-
51
-
52
-
53
-
54
-
55
-
56
-
57
-
58
-
59
-
60
-
61
-
62
-
63
-
64
-
65
-
66
-
67
-
68
-
69
-
70
-
71
-
72
-
73
-
74
-
75
-
76
-
77
-
78
-
79
-
80
-
81
-
82
-
83
-
84
-
85
-
86
-
87
-
88
-
89
-
90
-
91
-
92
-
93
-
94
-
95
-
96
-
97
-
98
-
99
-
100
-
101
-
102
-
 103
103 -
 104
104 -
 105
105 -
 106
106 -
 107
107 -
 108
108 -
 109
109 -
 110
110 -
 111
111 -
 112
112 -
 113
113 -
 114
114 -
 115
115 -
 116
116 -
 117
117 -
 118
118 -
 119
119 -
 120
120 -
 121
121 -
 122
122 -
 123
123 -
124
-
125
-
126
-
127
-
128
-
129
-
130
-
131
-
132
-
133
-
134
-
135
-
136
-
137
-
138
-
139
-
140
-
141
-
142
-
143
-
144
-
145
-
146
-
147
-
148
-
149
-
150
-
151
-
152
-
153
-
154
-
155
-
156
-
157
-
158
-
159
-
160
-
161
-
162
-
163
-
164
-
165
-
166
-
167
-
168
-
169
-
170
-
171
-
172
-
173
-
174
-
175
-
176
-
177
-
178
-
179
-
180
-
181
-
182
-
183
-
184
-
185
-
186
-
187
-
188
-
189
-
190
-
191
-
192
-
193
-
194
-
195
-
196
 |
 |

10-K
The 2010 effective tax rate is greater than the expected tax rate of 35% due primarily to the
inclusion of state income taxes in the total effective tax rate. The 2010 effective rate is less than the
2009 rate due principally to reductions in state income tax expense, income tax related interest expense
and other expense items. The 2010 effective resolution of various examinations by the taxing
authorities, when combined with unfavorable examination results in 2009, resulted in a decrease in the
year-to-year state income tax expense rate. This decrease in state income tax expense was partially
offset by an increase in state income tax expense due to a shift in income to companies within the
group that have a higher effective state income tax rate. In addition, decreases also occurred due to
favorable outcomes in 2010 associated with reductions in income tax related interest accruals and
income tax related penalty accruals due to favorable income tax examination results, the completion of
a federal income tax examination, and reductions in expense associated with uncertain tax benefit
accruals.
The 2009 effective tax rate is greater than the expected tax rate of 35% due primarily to the
inclusion of state income taxes in the total effective tax rate. The 2009 effective tax rate is less than the
2008 rate due principally to the unfavorable impact that the non-deductible, merger-related lawsuit
settlement had on the 2008 rate. This reduction in the effective tax rate was partially offset by a
decrease in the tax rate benefit related to federal jobs credits. While the total amount of jobs credits
earned in 2009 was similar to the amount earned in 2008, the impact of this benefit on the effective tax
rate was reduced due to the 2009 increase in income before tax. The 2009 rate was also increased by
accruals associated with uncertain tax benefits.
The 2008 effective income tax rate was greater than the expected tax rate of 35% principally due
to the non-deductibility of the settlement and related expenses associated with the shareholder lawsuit
related to our 2007 merger.
Off Balance Sheet Arrangements
We lease three of our distribution centers. The entities involved in the ownership structure
underlying these leases meet the accounting definition of a Variable Interest Entity (‘‘VIE’’). One of
these distribution centers has been recorded as a financing obligation whereby its property and
equipment are reflected in our consolidated balance sheets. The land and buildings of the other two
distribution centers have been recorded as operating leases. We are not the primary beneficiary of
these VIEs and, accordingly, have not included these entities in our consolidated financial statements.
Other than the foregoing, we are not party to any off balance sheet arrangements.
Effects of Inflation
In 2008, increased commodity cost pressures mainly related to food and pet products, which were
driven by fruit and vegetable prices and rising freight costs, increased the costs of certain products.
Increases in petroleum, resin, metals, pulp and other raw material commodity driven costs also resulted
in multiple product cost increases. We believe that our ability to increase selling prices in response to
cost increases largely mitigated the effect of these cost increases on our overall results of operations.
These 2008 trends generally reversed or stabilized in 2009 and 2010.
Liquidity and Capital Resources
Current Financial Condition and Recent Developments
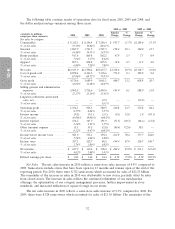
During the past three years, we have generated an aggregate of approximately $2.07 billion in cash
flows from operating activities. During that period, we expanded the number of stores we operate by
1,178, or over 14%, remodeled or relocated 1,358 stores, or approximately 14% of stores we operated
as of February 25, 2011, and incurred approximately $877 million in capital expenditures. We made
35