Dollar General 2010 Annual Report Download - page 111
Download and view the complete annual report
Please find page 111 of the 2010 Dollar General annual report below. You can navigate through the pages in the report by either clicking on the pages listed below, or by using the keyword search tool below to find specific information within the annual report.-
 1
1 -
2
-
3
-
4
-
5
-
6
-
7
-
8
-
9
-
10
-
11
-
12
-
13
-
14
-
15
-
16
-
17
-
18
-
19
-
20
-
21
-
22
-
23
-
24
-
25
-
26
-
27
-
28
-
29
-
30
-
31
-
32
-
33
-
34
-
35
-
36
-
37
-
38
-
39
-
40
-
41
-
42
-
43
-
44
-
45
-
46
-
47
-
48
-
49
-
50
-
51
-
52
-
53
-
54
-
55
-
56
-
57
-
58
-
59
-
60
-
61
-
62
-
63
-
64
-
65
-
66
-
67
-
68
-
69
-
70
-
71
-
72
-
73
-
74
-
75
-
76
-
77
-
78
-
79
-
80
-
81
-
82
-
83
-
84
-
85
-
86
-
87
-
88
-
89
-
90
-
91
-
92
-
93
-
94
-
95
-
96
-
97
-
98
-
99
-
100
-
 101
101 -
 102
102 -
 103
103 -
 104
104 -
 105
105 -
 106
106 -
 107
107 -
 108
108 -
 109
109 -
 110
110 -
 111
111 -
 112
112 -
 113
113 -
 114
114 -
 115
115 -
 116
116 -
 117
117 -
 118
118 -
 119
119 -
 120
120 -
 121
121 -
122
-
123
-
124
-
125
-
126
-
127
-
128
-
129
-
130
-
131
-
132
-
133
-
134
-
135
-
136
-
137
-
138
-
139
-
140
-
141
-
142
-
143
-
144
-
145
-
146
-
147
-
148
-
149
-
150
-
151
-
152
-
153
-
154
-
155
-
156
-
157
-
158
-
159
-
160
-
161
-
162
-
163
-
164
-
165
-
166
-
167
-
168
-
169
-
170
-
171
-
172
-
173
-
174
-
175
-
176
-
177
-
178
-
179
-
180
-
181
-
182
-
183
-
184
-
185
-
186
-
187
-
188
-
189
-
190
-
191
-
192
-
193
-
194
-
195
-
196
 |
 |

10-K
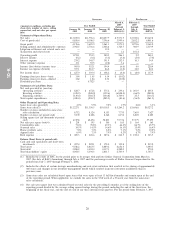
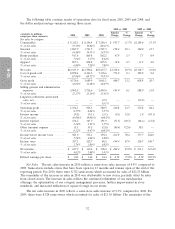
increase in sales in 2009 was attributable to new stores, partially offset by sales from closed stores. The
strong increase in sales reflects the results of our various initiatives implemented throughout 2008 and
2009, including the impact of improved store standards, the expansion of our merchandise offerings,
including significant enhancements to our convenience food and beverages and health and beauty
products, in addition to improved utilization of square footage, extended store hours and improved
marketing efforts.
Of our four major merchandise categories, the consumables category has grown most significantly
over the past several years. Although this category generally has a lower gross profit rate than the other
three categories, as discussed below, we were able to increase our overall gross profit rate in both 2010
and 2009 as compared to the previous year. Because of the impact of sales mix on gross profit, we
continually review our merchandise mix and strive to adjust it when appropriate. Maintaining an
appropriate sales mix is an integral part of achieving our gross profit and sales goals. Both the number
of customer transactions and average transaction amount increased in 2010 and 2009, and we believe
that our stores have benefited to some degree from attracting new customers who are seeking value as
a result of the recent economic environment.
Gross Profit. The gross profit rate as a percentage of sales was 32.0% in 2010 compared to 31.3%
in 2009. Factors contributing to the increase in the 2010 gross profit rate include increased markups
resulting primarily from higher purchase markups, partially offset by increased markdowns, as well as
our category management efforts and increased sales volumes which have contributed to our ability to
reduce purchase costs from our vendors. Our merchandising team continues to work closely with our
vendors to provide quality merchandise at value prices to meet our customers’ demands. In 2010 we
recorded a LIFO provision of $5.3 million, reflecting an increase in certain merchandise costs, the most
significant of which occurred in the 2010 fourth quarter, compared to a LIFO benefit of $2.5 million in
2009.
The gross profit rate as a percentage of sales was 31.3% in 2009 compared to 29.3% in 2008.
Factors contributing to the increase in the 2009 gross profit rate include increased markups resulting
primarily from higher purchase markups, partially offset by increased markdowns. In addition, our
increased sales volumes have contributed to our ability to reduce purchase costs from our vendors.
Transportation and distribution costs decreased for the year driven by lower fuel costs as well as the
impact of cost reduction initiatives. Higher sales volumes and productivity initiatives also contributed to
improved leverage of our distribution costs. In addition, inventory shrinkage as a percentage of sales
declined in 2009 from 2008, contributing to our gross profit rate improvement. In 2009 we recorded a
LIFO benefit of $2.5 million, reflecting a flattening of merchandise costs in 2009, compared to a LIFO
provision of $43.9 million in 2008, when we faced increased commodity cost pressures mainly related to
food and pet products which were driven by rising fruit and vegetable prices and freight costs. Increases
in petroleum, resin, metals, pulp and other raw material commodity driven costs also resulted in
multiple product cost increases in 2008. Also in 2008, we marked down merchandise as the result of
our interpretation of the phthalates provision of the Consumer Product Safety Improvement Act of
2008, resulting in a charge of $8.6 million.
Selling, General and Administrative (‘‘SG&A’’) Expense. SG&A expense was 22.3% as a percentage
of sales in 2010 compared to 23.2% in 2009, a decrease of 93 basis points. SG&A in 2010 included
expenses totaling $19.7 million, or 15 basis points, relating to two secondary offerings of our common
stock, consisting of $1.1 million of legal and other transaction expenses and $18.6 million relating to the
acceleration of certain equity appreciation rights. SG&A in 2009 included expenses totaling
$68.3 million, or 58 basis points, including $58.8 million relating to the termination of an advisory
agreement among us, KKR and Goldman, Sachs & Co. and $9.4 million resulting from the acceleration
of certain equity based compensation related to the completion of our initial public offering. Decreases
in incentive compensation, the cost of health benefits, consulting fees and severance costs contributed
to the overall decrease in SG&A as a percentage of sales, as did other cost reduction and productivity
33