Dollar General 2010 Annual Report Download - page 82
Download and view the complete annual report
Please find page 82 of the 2010 Dollar General annual report below. You can navigate through the pages in the report by either clicking on the pages listed below, or by using the keyword search tool below to find specific information within the annual report.-
 1
1 -
2
-
3
-
4
-
5
-
6
-
7
-
8
-
9
-
10
-
11
-
12
-
13
-
14
-
15
-
16
-
17
-
18
-
19
-
20
-
21
-
22
-
23
-
24
-
25
-
26
-
27
-
28
-
29
-
30
-
31
-
32
-
33
-
34
-
35
-
36
-
37
-
38
-
39
-
40
-
41
-
42
-
43
-
44
-
45
-
46
-
47
-
48
-
49
-
50
-
51
-
52
-
53
-
54
-
55
-
56
-
57
-
58
-
59
-
60
-
61
-
62
-
63
-
64
-
65
-
66
-
67
-
68
-
69
-
70
-
71
-
 72
72 -
 73
73 -
 74
74 -
 75
75 -
 76
76 -
 77
77 -
 78
78 -
 79
79 -
 80
80 -
 81
81 -
 82
82 -
 83
83 -
 84
84 -
 85
85 -
 86
86 -
 87
87 -
 88
88 -
 89
89 -
 90
90 -
 91
91 -
 92
92 -
93
-
94
-
95
-
96
-
97
-
98
-
99
-
100
-
101
-
102
-
103
-
104
-
105
-
106
-
107
-
108
-
109
-
110
-
111
-
112
-
113
-
114
-
115
-
116
-
117
-
118
-
119
-
120
-
121
-
122
-
123
-
124
-
125
-
126
-
127
-
128
-
129
-
130
-
131
-
132
-
133
-
134
-
135
-
136
-
137
-
138
-
139
-
140
-
141
-
142
-
143
-
144
-
145
-
146
-
147
-
148
-
149
-
150
-
151
-
152
-
153
-
154
-
155
-
156
-
157
-
158
-
159
-
160
-
161
-
162
-
163
-
164
-
165
-
166
-
167
-
168
-
169
-
170
-
171
-
172
-
173
-
174
-
175
-
176
-
177
-
178
-
179
-
180
-
181
-
182
-
183
-
184
-
185
-
186
-
187
-
188
-
189
-
190
-
191
-
192
-
193
-
194
-
195
-
196
 |
 |

10-K
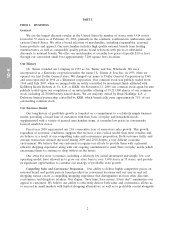
Our Growth Strategy
We believe we have the right strategy and execution capabilities to capitalize on the considerable
growth opportunities afforded by our business model. We believe we continue to have significant
opportunities to drive profitable growth through increasing same-store sales, expanding our operating
profit rate and growing our store base.
Increasing Same-Store Sales. We believe the combination of our necessity-driven product mix and
our attractive value proposition, including a well-balanced merchandising approach, provides a strong
basis for increased sales. Our average sales per square foot increased to $201 in 2010 from $195 in
2009 and $180 in 2008. We believe we will continue to have additional opportunities to increase our
store productivity through improved in-stock positions, price optimization, continued improvements in
space utilization, and additional operating and merchandising initiatives. Among numerous additional
projects in 2011, we plan to further expand our frozen and refrigerated food and health and beauty
aids offerings. We will also continue to focus on increasing sales in our home, apparel and seasonal
categories.
In addition, we plan to relocate or remodel approximately 550 stores in 2011, which we expect to
further drive same-store sales growth. In 2010, we remodeled or relocated 504 stores. Remodels and
relocations generally consist of updating the stores to our new customer centric format, which we
believe appeals to a broader customer base. A relocation typically results in an improved, more visible
and accessible location, and usually includes increased square footage. We continue to have
opportunities for additional remodels and relocations beyond 2011.
Expanding Operating Profit Rate. Another key component of our growth strategy is improving our
operating profit rate through enhanced gross profit and expense reduction initiatives. Our financial
results during 2010 and 2009 reflect the favorable impact of our strong category management processes
on gross margin improvement and our continued efforts to reduce selling, general and administrative
expenses as a percent of sales.
In recent months, we have begun to see many of our product categories impacted by increased
costs of commodities, including cotton, wheat, corn, sugar, coffee and resin, as well as increased
transportation fuel costs, which have increased significantly in early 2011. These increases pose a
challenge to our continued priority of improving our gross profit rate. However, we believe we have
options available to mitigate the impact of these increases, including our price optimization, changes to
our product selection, such as alternate national brands and the expansion of our private brands, and
modifications to our packaging and product size, including items in our planned expansion of
merchandise selections priced at $1.00. In addition, we continue to focus on reducing inventory
shrinkage and improving distribution efficiencies.
We intend to continue to drive our private brand penetration going forward. Our private brand
program complements our model of offering customers nationally branded consumables merchandise at
everyday low prices. Generally, private brand items have higher gross profit margins than similar
national brand items, and in 2010 represented approximately 22% of our consumables sales. In 2010,
we made significant progress in expanding our private brand efforts to our non-consumable offerings,
dramatically improving the visual impact of our many non-consumables, including housewares,
domestics, lawn and garden tools and summer toys.
We believe we have the potential to directly source a larger portion of our products at significant
savings to current costs. In 2010, we imported approximately $750 million of goods, or 8% of total
purchases, at cost.
We continually look for ways to improve our cost structure and enhance efficiencies throughout
the organization. In 2010, we centralized our procurement system which we expect to aid us in reducing
the cost of purchases throughout the company in 2011 and beyond. In addition, we have begun to
implement a store labor management and work simplification program, and we are continuing our store
rent reduction initiative.
4