Dollar General 2010 Annual Report Download - page 176
Download and view the complete annual report
Please find page 176 of the 2010 Dollar General annual report below. You can navigate through the pages in the report by either clicking on the pages listed below, or by using the keyword search tool below to find specific information within the annual report.-
 1
1 -
2
-
3
-
4
-
5
-
6
-
7
-
8
-
9
-
10
-
11
-
12
-
13
-
14
-
15
-
16
-
17
-
18
-
19
-
20
-
21
-
22
-
23
-
24
-
25
-
26
-
27
-
28
-
29
-
30
-
31
-
32
-
33
-
34
-
35
-
36
-
37
-
38
-
39
-
40
-
41
-
42
-
43
-
44
-
45
-
46
-
47
-
48
-
49
-
50
-
51
-
52
-
53
-
54
-
55
-
56
-
57
-
58
-
59
-
60
-
61
-
62
-
63
-
64
-
65
-
66
-
67
-
68
-
69
-
70
-
71
-
72
-
73
-
74
-
75
-
76
-
77
-
78
-
79
-
80
-
81
-
82
-
83
-
84
-
85
-
86
-
87
-
88
-
89
-
90
-
91
-
92
-
93
-
94
-
95
-
96
-
97
-
98
-
99
-
100
-
101
-
102
-
103
-
104
-
105
-
106
-
107
-
108
-
109
-
110
-
111
-
112
-
113
-
114
-
115
-
116
-
117
-
118
-
119
-
120
-
121
-
122
-
123
-
124
-
125
-
126
-
127
-
128
-
129
-
130
-
131
-
132
-
133
-
134
-
135
-
136
-
137
-
138
-
139
-
140
-
141
-
142
-
143
-
144
-
145
-
146
-
147
-
148
-
149
-
150
-
151
-
152
-
153
-
154
-
155
-
156
-
157
-
158
-
159
-
160
-
161
-
162
-
163
-
164
-
165
-
 166
166 -
 167
167 -
 168
168 -
 169
169 -
 170
170 -
 171
171 -
 172
172 -
 173
173 -
 174
174 -
 175
175 -
 176
176 -
 177
177 -
 178
178 -
 179
179 -
 180
180 -
 181
181 -
 182
182 -
 183
183 -
 184
184 -
 185
185 -
 186
186 -
187
-
188
-
189
-
190
-
191
-
192
-
193
-
194
-
195
-
196
 |
 |

10-K
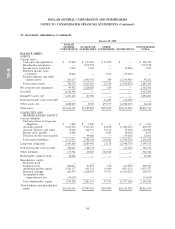
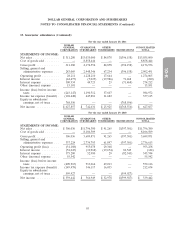
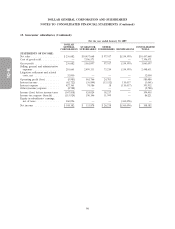
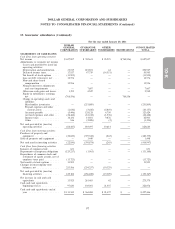
DOLLAR GENERAL CORPORATION AND SUBSIDIARIES
NOTES TO CONSOLIDATED FINANCIAL STATEMENTS (Continued)
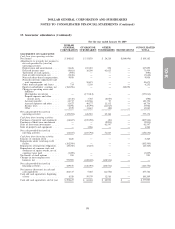
15. Guarantor subsidiaries (Continued)
For the year ended January 29, 2010
DOLLAR
GENERAL GUARANTOR OTHER CONSOLIDATED
CORPORATION SUBSIDIARIES SUBSIDIARIES ELIMINATIONS TOTAL
STATEMENTS OF CASH FLOWS:
Cash flows from operating activities:
Net income .................. $339,442 $ 566,949 $ 32,978 $(599,927) $ 339,442
Adjustments to reconcile net income to
net cash provided by (used in)
operating activities:
Depreciation and amortization .... 36,541 220,048 182 — 256,771
Deferred income taxes ......... (18,571) 67,317 (33,886) — 14,860
Tax benefit of stock options ...... (5,390) — — — (5,390)
Loss on debt retirement, net ...... 55,265 — — — 55,265
Non-cash share-based compensation . 17,295 — — — 17,295
Noncash inventory adjustments and
asset impairments ........... — 647 — — 647
Other non-cash gains and losses . . . 3,221 4,699 — — 7,920
Equity in subsidiaries’ earnings, net . (599,927) — — 599,927 —
Change in operating assets and
liabilities:
Merchandise inventories ....... — (100,248) — — (100,248)
Prepaid expenses and other current
assets ................. 2,582 (10,252) 372 — (7,298)
Accounts payable ........... 26,535 79,515 (1) — 106,049
Accrued expenses and other .... (20,672) 10,494 (2,465) — (12,643)
Income taxes .............. 48,494 (50,112) 2,771 — 1,153
Other .................. (3,203) 2,171 32 — (1,000)
Net cash provided by (used in)
operating activities ............ (118,388) 791,228 (17) — 672,823
Cash flows from investing activities:
Purchases of property and equipment . . (34,647) (216,032) (68) — (250,747)
Sales of property and equipment .... — 2,701 — — 2,701
Net cash used in investing activities . . . (34,647) (213,331) (68) — (248,046)
Cash flows from financing activities:
Issuance of common stock ........ 443,753 — — — 443,753
Issuance of long-term obligations .... — 1,080 — — 1,080
Repayments of long-term obligations . . (782,518) (2,742) — — (785,260)
Payment of cash dividends and related
amounts .................. (239,731) — — — (239,731)
Repurchases of common stock and
settlement of equity awards, net of
employee taxes paid ........... (5,928) — — — (5,928)
Tax benefit of stock options ........ 5,390 — — — 5,390
Changes in intercompany note balances,
net...................... 537,052 (537,638) 586 — —
Net cash provided by (used in)
financing activities ............ (41,982) (539,300) 586 — (580,696)
Net increase (decrease) in cash and
cash equivalents ............. (195,017) 38,597 501 — (155,919)
Cash and cash equivalents, beginning of
year ..................... 292,637 64,404 20,954 — 377,995
Cash and cash equivalents, end of year . $ 97,620 $ 103,001 $ 21,455 $ — $ 222,076
98