Dollar General 2010 Annual Report Download - page 32
Download and view the complete annual report
Please find page 32 of the 2010 Dollar General annual report below. You can navigate through the pages in the report by either clicking on the pages listed below, or by using the keyword search tool below to find specific information within the annual report.-
 1
1 -
2
-
3
-
4
-
5
-
6
-
7
-
8
-
9
-
10
-
11
-
12
-
13
-
14
-
15
-
16
-
17
-
18
-
19
-
20
-
21
-
 22
22 -
 23
23 -
 24
24 -
 25
25 -
 26
26 -
 27
27 -
 28
28 -
 29
29 -
 30
30 -
 31
31 -
 32
32 -
 33
33 -
 34
34 -
 35
35 -
 36
36 -
 37
37 -
 38
38 -
 39
39 -
 40
40 -
 41
41 -
 42
42 -
43
-
44
-
45
-
46
-
47
-
48
-
49
-
50
-
51
-
52
-
53
-
54
-
55
-
56
-
57
-
58
-
59
-
60
-
61
-
62
-
63
-
64
-
65
-
66
-
67
-
68
-
69
-
70
-
71
-
72
-
73
-
74
-
75
-
76
-
77
-
78
-
79
-
80
-
81
-
82
-
83
-
84
-
85
-
86
-
87
-
88
-
89
-
90
-
91
-
92
-
93
-
94
-
95
-
96
-
97
-
98
-
99
-
100
-
101
-
102
-
103
-
104
-
105
-
106
-
107
-
108
-
109
-
110
-
111
-
112
-
113
-
114
-
115
-
116
-
117
-
118
-
119
-
120
-
121
-
122
-
123
-
124
-
125
-
126
-
127
-
128
-
129
-
130
-
131
-
132
-
133
-
134
-
135
-
136
-
137
-
138
-
139
-
140
-
141
-
142
-
143
-
144
-
145
-
146
-
147
-
148
-
149
-
150
-
151
-
152
-
153
-
154
-
155
-
156
-
157
-
158
-
159
-
160
-
161
-
162
-
163
-
164
-
165
-
166
-
167
-
168
-
169
-
170
-
171
-
172
-
173
-
174
-
175
-
176
-
177
-
178
-
179
-
180
-
181
-
182
-
183
-
184
-
185
-
186
-
187
-
188
-
189
-
190
-
191
-
192
-
193
-
194
-
195
-
196
 |
 |

Proxy
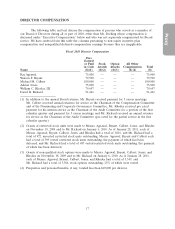
EXECUTIVE COMPENSATION
We refer to the persons included in the Summary Compensation Table below as our ‘‘named
executive officers.’’ References to ‘‘2011,’’ ‘‘2010,’’ ‘‘2009,’’ ‘‘2008,’’ and ‘‘2007’’ mean, respectively, our
fiscal years ending or ended February 3, 2012, January 28, 2011, January 29, 2010, January 30, 2009,
and February 1, 2008. References to the ‘‘merger’’ or the ‘‘2007 merger’’ mean our merger that
occurred on July 6, 2007 as a result of which substantially all of our common stock became owned by
Buck Holdings, L.P. (‘‘Buck’’), a Delaware limited partnership controlled by investment funds affiliated
with Kohlberg Kravis Roberts & Co. L.P. (‘‘KKR’’). Buck continues to own in excess of 70% of our
outstanding common stock.
Compensation Discussion and Analysis
Executive Overview
The overarching goal of our executive compensation program is to serve the long-term interests
of our shareholders. A competitive executive compensation package is critical for us to attract, retain
and motivate persons who we believe have the ability and desire to deliver superior shareholder
returns. We strive to balance the short-term and long-term components of our executive compensation
program to incent achievement of both our annual and long-term business strategies, to pay for
performance and to maintain our competitive position in the market in which we compete for executive
talent. We believe the success of our program is evidenced by the following key financial and operating
results for 2010:
• Total sales increased 10.5% over 2009. Sales in same-stores increased 4.9%, following a
strong 9.5% increase in 2009.
• Gross profit, as a percentage of sales, was 32.0%, an increase of 76 basis points over 2009.
• SG&A, as a percentage of sales, was 22.3% compared to 23.2% in 2009.
• We reported net income of $627.9 million, or $1.82 per diluted share, compared to net
income of $339.4 million, or $1.04 per diluted share, in 2009.
• We generated approximately $825 million of cash flows from operating activities, an increase
of over 22% compared to 2009.
• We opened 600 new stores, remodeled or relocated 504 stores, and closed 56 stores, resulting
in a store count of 9,372 on January 28, 2011.
• Adjusted EBITDA, as defined and calculated for purposes of both our annual Teamshare
bonus program and our outstanding performance-based stock option awards, was
$1.56 billion versus $1.28 billion in 2009.
• ROIC, as defined and calculated for purposes of our annual Teamshare bonus program, was
22.31%.
While our executive compensation program in 2010 remained relatively unchanged from the
last several years, the following identifies material items pertaining to our named executive officers:
• We negotiated an amended and restated employment agreement with Mr. Dreiling.
• We awarded Mr. Dreiling a special stock option grant to both recognize his role in achieving
our superior financial results and to incentivize further outstanding financial performance.
• We added ROIC as a second performance metric to our short-term cash incentive plan for
officer-level employees in order to recognize the importance of (1) our ability to achieve an
24