Dollar General 2010 Annual Report Download - page 133
Download and view the complete annual report
Please find page 133 of the 2010 Dollar General annual report below. You can navigate through the pages in the report by either clicking on the pages listed below, or by using the keyword search tool below to find specific information within the annual report.-
 1
1 -
2
-
3
-
4
-
5
-
6
-
7
-
8
-
9
-
10
-
11
-
12
-
13
-
14
-
15
-
16
-
17
-
18
-
19
-
20
-
21
-
22
-
23
-
24
-
25
-
26
-
27
-
28
-
29
-
30
-
31
-
32
-
33
-
34
-
35
-
36
-
37
-
38
-
39
-
40
-
41
-
42
-
43
-
44
-
45
-
46
-
47
-
48
-
49
-
50
-
51
-
52
-
53
-
54
-
55
-
56
-
57
-
58
-
59
-
60
-
61
-
62
-
63
-
64
-
65
-
66
-
67
-
68
-
69
-
70
-
71
-
72
-
73
-
74
-
75
-
76
-
77
-
78
-
79
-
80
-
81
-
82
-
83
-
84
-
85
-
86
-
87
-
88
-
89
-
90
-
91
-
92
-
93
-
94
-
95
-
96
-
97
-
98
-
99
-
100
-
101
-
102
-
103
-
104
-
105
-
106
-
107
-
108
-
109
-
110
-
111
-
112
-
113
-
114
-
115
-
116
-
117
-
118
-
119
-
120
-
121
-
122
-
 123
123 -
 124
124 -
 125
125 -
 126
126 -
 127
127 -
 128
128 -
 129
129 -
 130
130 -
 131
131 -
 132
132 -
 133
133 -
 134
134 -
 135
135 -
 136
136 -
 137
137 -
 138
138 -
 139
139 -
 140
140 -
 141
141 -
 142
142 -
 143
143 -
144
-
145
-
146
-
147
-
148
-
149
-
150
-
151
-
152
-
153
-
154
-
155
-
156
-
157
-
158
-
159
-
160
-
161
-
162
-
163
-
164
-
165
-
166
-
167
-
168
-
169
-
170
-
171
-
172
-
173
-
174
-
175
-
176
-
177
-
178
-
179
-
180
-
181
-
182
-
183
-
184
-
185
-
186
-
187
-
188
-
189
-
190
-
191
-
192
-
193
-
194
-
195
-
196
 |
 |

10-K
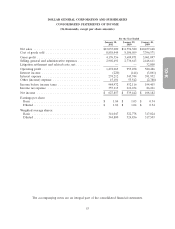
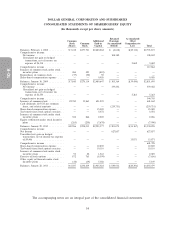
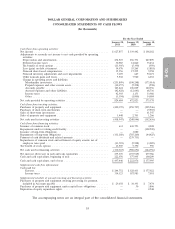
DOLLAR GENERAL CORPORATION AND SUBSIDIARIES
CONSOLIDATED STATEMENTS OF CASH FLOWS
(In thousands)
For the Year Ended
January 28, January 29, January 30,
2011 2010 2009
Cash flows from operating activities:
Net income ............................................. $627,857 $ 339,442 $ 108,182
Adjustments to reconcile net income to net cash provided by operating
activities:
Depreciation and amortization ............................... 254,927 256,771 247,899
Deferred income taxes .................................... 50,985 14,860 73,434
Tax benefit of stock options ................................. (13,905) (5,390) (950)
Loss (gain) on debt retirement ............................... 14,576 55,265 (3,818)
Noncash share-based compensation ............................ 15,956 17,295 9,958
Noncash inventory adjustments and asset impairments ............... 7,607 647 50,671
Other noncash gains and losses .............................. 5,942 7,920 6,252
Change in operating assets and liabilities:
Merchandise inventories .................................. (251,809) (100,248) (173,014)
Prepaid expenses and other current assets ...................... (10,157) (7,298) (598)
Accounts payable ...................................... 123,424 106,049 140,356
Accrued expenses and other liabilities ......................... (42,428) (12,643) 68,736
Income taxes ......................................... 42,903 1,153 33,986
Other .............................................. (1,194) (1,000) 14,084
Net cash provided by operating activities .......................... 824,684 672,823 575,178
Cash flows from investing activities:
Purchases of property and equipment ............................ (420,395) (250,747) (205,546)
Purchases of short-term investments ............................. — — (9,903)
Sales of short-term investments ................................ — — 61,547
Sales of property and equipment ............................... 1,448 2,701 1,266
Net cash used in investing activities ............................. (418,947) (248,046) (152,636)
Cash flows from financing activities:
Issuance of common stock ................................... 631 443,753 4,228
Repayments under revolving credit facility ......................... — — (102,500)
Issuance of long-term obligations ............................... — 1,080 —
Repayments of long-term obligations ............................ (131,180) (785,260) (44,425)
Payment of cash dividends and related amounts ..................... — (239,731) —
Repurchases of common stock and settlement of equity awards, net of
employee taxes paid ...................................... (13,723) (5,928) (3,009)
Tax benefit of stock options .................................. 13,905 5,390 950
Net cash used in financing activities ............................. (130,367) (580,696) (144,756)
Net increase (decrease) in cash and cash equivalents .................. 275,370 (155,919) 277,786
Cash and cash equivalents, beginning of year ....................... 222,076 377,995 100,209
Cash and cash equivalents, end of year ........................... $497,446 $ 222,076 $ 377,995
Supplemental cash flow information:
Cash paid for:
Interest ............................................. $244,752 $ 328,433 $ 377,022
Income taxes ......................................... 314,123 187,983 7,091
Supplemental schedule of noncash investing and financing activities:
Purchases of property and equipment awaiting processing for payment,
included in Accounts payable ................................ $ 29,658 $ 30,393 $ 7,474
Purchases of property and equipment under capital lease obligations ....... — 50 3,806
Expiration of equity repurchase rights ............................ — — 2,548
The accompanying notes are an integral part of the consolidated financial statements.
55